Advancing Racial Equity With State Tax Policy
States and localities could do more to help undo the harmful legacies of past racism and the damage caused by continuing racial bias and discrimination. If state budget and tax policies were better designed to address these harms and create more opportunities for people of color, state economies would be more equitable and likely also would be stronger, which in turn could benefit many state residents of all backgrounds.
States and localities could do more to help undo the harmful legacies of past racism and the damage caused by continuing racial bias and discrimination.States and local governments account for nearly half of all domestic public-sector spending, and most of the funding for education and certain other investments important for economic growth. As such, how states and localities raise and spend revenue, including what services they finance, has major implications for racial and ethnic equity. Yet, while in recent decades people of color have made progress in many areas, state and local fiscal policies too often have not been part of this progress and instead have extended or cemented racial disparities in power and wealth.
Discriminatory public policies and racially prejudiced public and private actions of the past contributed to a historical context in which people of color were systematically held back. For much of our nation’s history, people of color had little to no power in state legislatures, and white lawmakers could set policies that sustained white dominance, even in states where people of color were a significant share or even a majority of the population. In that sort of environment, state and local tax policies often deepened the profound challenges that people of color faced, even when those tax policies were not explicitly race-based. Examples of such policies that remain in place today include:
- The oldest supermajority requirement. In the post-Reconstruction era, wealthy white landowners in Mississippi demanded and won a constitutional requirement for a three-fifths vote in both houses of the legislature for all state tax increases, the oldest such requirement still on the books in any state. Delegates adopted the measure at a state constitutional convention in 1890, the same convention at which they disenfranchised nearly all of the state’s Black voters. Referring to his fellow convention delegates, the delegate who introduced the supermajority requirement stated, “All understood and desired that some scheme would be evolved which would effectually remove from the sphere of politics in the State the ignorant and unpatriotic negro.” While he was referring to the convention’s aim of stripping political power from Black people, the supermajority requirement that the delegate championed added further to the barriers that Black people faced (and continue to face), by making public investments in schools and other public services that much more difficult to secure and adequately fund. Later in the Jim Crow era, Arkansas and Louisiana also adopted supermajority requirements to raise revenue, which remain in place today.[1]
- Some of the earliest property tax limits. During state constitutional conventions called in 1875 and 1901 to re-establish white dominance following Reconstruction, Alabama adopted constitutional property tax limits that are among the oldest still on the books. Installing highly restrictive property tax limits in Alabama’s constitution protected white property owners in the state from the possibility that African Americans and their allies could return to power and substantially increase property tax rates to fund education and other such measures. These limits have now been in place for over 140 years, producing a harmful cumulative effect. Today, Alabama’s property tax revenue as a share of its economy is the lowest of any state in the country, seriously hampering the ability of local governments to provide adequate schools and other public services. During this period in Southern history, Arkansas, Missouri, and Texas also adopted constitutional property tax limits that remain in force today.[2]
- The first modern sales tax. In 1932, Mississippi adopted the nation’s first modern retail sales tax, a tax that generally falls hardest on those with the least income (because sales taxes consume a larger share of their income). The state’s governor urged adopting the new tax in part by emphasizing that the revenue would be used to reduce property taxes, and that as a result it would shift the state tax base away from property owners and more heavily onto consumers. What that meant in practice was a reduction in taxes owed by mostly white property owners and an increase in those owed by Black households that owned little or no property and had little else to tax. Other states across the country adopted sales taxes not long after Mississippi demonstrated the tax’s feasibility and its significant revenue-raising power.[3]
If states work to overcome racial inequities, in part by improving their tax and budget policies and more adequately financing needed public services such as education, the well-being and productivity of states’ workforces should improve, which in turn should broadly benefit state economies.[4] While the specific needs of states vary, lawmakers can pursue fiscal policies that:
- Ensure that households with high incomes pay a larger share of their income in state and local taxes than households with lower incomes — the opposite of the upside-down tax systems in place in 9 of every 10 states today. Most states’ tax structures actually worsen racial and ethnic inequities because the tax structures are regressive and households of color are more likely to have lower incomes and less wealth than white households. States can take steps such as strengthening their income taxes and otherwise improving the structures of their tax systems, better taxing wealth, enacting or expanding tax credits for low-income families, and eliminating various fees used to raise resources for the courts, and other parts of the justice system, that can trap low-income individuals — often people of color — within cycles of debt and criminal justice involvement.
- Raise sufficient revenue for high-quality schools in all communities and for other investments in education, infrastructure, health, and the like, and target spending to help overcome racial and ethnic[5] inequities and build an economy whose benefits are more widely shared. Specific steps that states can take include eliminating wasteful subsidies that allow corporations to avoid paying taxes on their profits, raising income tax rates for the most affluent, modernizing state sales taxes, and better taxing carbon pollution and natural resource extraction. States can also better target their current spending, for example by reforming their criminal justice policies and using the savings from reduced incarceration to finance investments in low-income communities — particularly communities of color — and by reforming their school funding formulas to invest more in such communities. (Other education reforms are also necessary, but likely won’t be sufficient by themselves in the absence of additional funding.)
- Improve the fiscal policy “rules of the game” so lawmakers don’t face artificial constraints that prevent them from raising more revenue from wealthier residents or to finance public investments that can promote broadly shared prosperity. Steps that states can take include reforming or repealing constitutional limits on property taxes; overturning other formulaic restrictions on revenue raising; eliminating supermajority requirements for raising taxes or eliminating unproductive, inefficient tax breaks; and improving the rules governing their “rainy day” funds.
State economies and communities generally do better when they make public investments that can enable their residents to more fully realize their potential, including: good schools to offer low-income children a better chance at a successful future;[6] affordable colleges to boost opportunities for a broader group of students;[7] economic supports to help struggling working families have stable housing, nutritious food, and lives that aren’t filled with intense stress that has been found to affect children adversely;[8] and health coverage to protect against health-related bankruptcies and other financial hardship, while producing a healthier, more productive workforce.[9] When they are strong and administered with equity in mind, these kinds of public investments can help break down barriers to opportunity for communities of color and help more Americans achieve their potential, to the benefit of the broader economy. These investments will be still more effective if states and localities couple them with other policies that can improve equity such as boosting minimum wages, adopting family leave and sick leave policies, and protecting workers’ right to form unions.
Racial, Ethnic Biases Continue to Hold Back State Economies, People of Color
Racial discrimination and bias harm people of color. In addition, the overall economy is adversely affected when some people are held back from doing work that takes maximum advantage of their skills or from accessing opportunities that would boost their economic contributions. In short, when the productive potential of people of color is underused, the broader economy is affected. States that adopt policies that can overcome barriers erected by historical racism and reduce racial discrimination consequentially should become more prosperous over time.[10]
But to pursue this path, states will need to take action to undo the legacy of historical racism and the ongoing damage from continued racial discrimination and bias.
The size of that challenge is starkly illustrated by the large racial disparities in the distribution of wealth — the “racial wealth gap.”[11] Wealth accumulates over time and over generations, so its distribution today reflects, among other things, the cumulative impact of many types of racial disadvantage and discrimination. Racial disparities in income remain stark as well, which reduces the ability of families of color to build wealth in the present and future.[12]
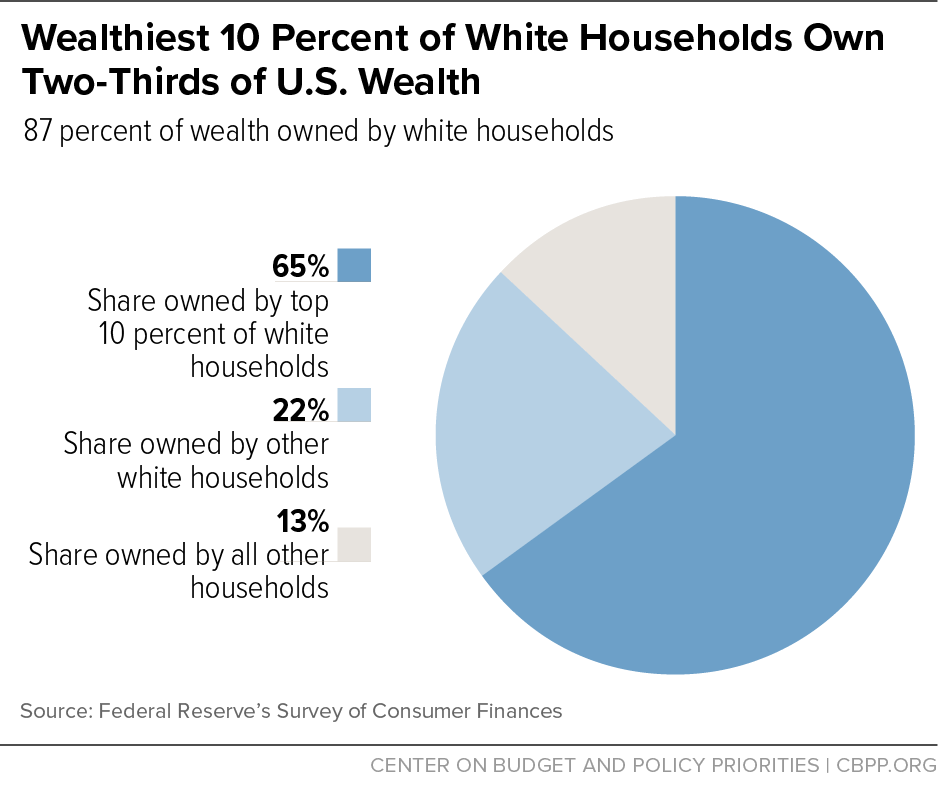
Overall, much of the nation’s wealth is concentrated in a small number of people, with the wealthiest 1 percent holding about 40 percent of net wealth — nearly double the share held by the bottom 90 percent.[13] This high level of wealth concentration combines with historical and contemporary racial discrimination to produce patterns of wealth holding that are highly unequal along lines of race and ethnicity. In total, white households — which comprise 65 percent of all households — own 87 percent of the nation’s wealth. Of particular note, the wealthiest 10 percent of white households own nearly two-thirds of the nation’s wealth.[14] (See Figure 1.) By contrast, people of color account for 35 percent of all households but just 13 percent of the nation’s wealth.
These racial disparities show up for a variety of sources of wealth. For example, non-Hispanic white landowners own 98 percent of the country’s private agricultural acreage.[15] White-owned businesses collect 88 percent of all business sales revenue in the country.[16]
Furthermore, the median net worth of white households ($171,000) is ten times the median net worth of Black households ($17,600) and eight times that of Latinx[17] households ($20,700).[18] While the median wealth of Asian American households is now comparable to that of white households, it varies greatly among people of different Asian heritages; and among those with lower incomes, Asian American households hold less wealth than white households do.[19] No recent data are available on the median wealth of Native American households, but data from 2000 found it to be very low relative to white households, and more recent data confirm high levels of poverty and low median incomes among Native Americans.[20]
Even just among low-income Americans, the racial wealth gap remains significant, though it narrowed after the last recession (mostly because white households with low incomes saw their wealth fall sharply, likely because the values of their homes declined; little of the narrowing was due to rising wealth among low-income African Americans or Latinx households). The already large racial wealth gap among middle-income households worsened over the same period.[21]
A combination of past and present public- and private-sector discrimination and bias appears to have played a profound role in producing these large racial disparities in wealth and income. Historically, racist behavior by private individuals was reinforced by government actions, from the wide variety of policies that supported slavery in much of the country, to the confiscation of Native American tribal land and other resources and their transference to white residents and white-owned companies,[22] and the forced internment of Japanese-Americans during World War II, which reduced their wealth and property. Other government policies that ended more recently but whose effects are still being felt include those that segregated African Americans in lower-value housing jurisdictions, thereby reducing their ability to build wealth.[23]
While federal and local housing policies are no longer explicitly discriminatory, private-sector racial discrimination persists. Independent investigations, such as those undertaken in recent years by the National Fair Housing Alliance, have found that real estate agents continue at times to effectively promote segregation by denying Black families the opportunity to buy into high-value areas with better schools and stronger housing markets, which can help build wealth.[24] In recent tests, African American homebuyers were told about and shown about 17 percent fewer available homes than equally qualified white homebuyers.[25]
In addition, many studies have documented the prevalence of racial discrimination in the private job market. Applicants of color with ethnic sounding names or whose race or ethnicity is otherwise known often face discrimination at the outset of the hiring process. A meta-analysis of every available field experiment of recent decades that tested job discrimination in hiring found no change in discrimination against African American job applicants today compared to 1989.[26] One study found that job candidates with white-sounding names were 50 percent more likely to make it to the interview stage than comparable candidates with Black-sounding names.[27] Another study found that among low-wage job seekers, Black applicants with no criminal record were no more likely to receive a call back or job offer than white applicants with the same qualifications and a criminal record.[28] Other research suggests that the unconscious but widespread perceptual biases that people hold — implicit associations based on characteristics such as accents and skin color that have built up over time through exposure to the racism embedded in our social, economic, and political systems and culture — privilege white people and disadvantage people of color in hiring and workplace dynamics.[29]
Still other research has shown how implicit racial bias affects the perceptions of police officers, teachers, and others in the public sector in ways that disadvantage people of color, sometimes with severe consequences (especially when the criminal justice system is involved).[30] States and localities have at times taken steps to help diminish discrimination and bias, as when certain localities have altered their policing strategies and police training policies to reduce racial bias, or when states and localities have promulgated “hate crime” laws and fair housing statutes. But given the continued prevalence of discrimination and bias, much remains to be done.
State and Local Tax Policy Is Not Race Neutral
State policymakers may be tempted to think of state and local tax policy as neutral with respect to race. Statutes do not mention race or ethnicity. And tax liabilities are determined using mathematical calculations based not on one’s race but on the amount and type of one’s income, consumption, property value, and the like. Yet historical racism and contemporary patterns of racial discrimination and bias can affect a taxpayer’s income and consumption, and the value of property the taxpayer may own. Moreover, fiscal policies need not be explicitly race-based to worsen or extend longstanding racial inequities. Policies can have those effects if they ignore the history of governmental and private actions that enforced racial segregation and held back people of color, as well as the continuing impact of racial bias and discrimination.
State lawmakers operated for many years within a culture in which the belief that white people are inherently superior to people of other racial groups was widely accepted and sometimes openly expressed. At times, in fact, white supremacy was an explicit policy goal. For example, the individual serving as the president of a state constitutional convention in Alabama in 1901 opened the convention by expressing his fear of “negro rule,” declaring, “What is it that we want to do? Why it is within the limits imposed by the Federal Constitution to establish white supremacy in this State.”[31]
To be sure, people of color have made progress in many areas. But reforms of state and local fiscal policies that can reinforce racial inequities too often have not been part of the measures taken, and in some areas, fiscal policies have extended or cemented racial disparities in wealth and power. State and local lawmakers would do well to take stronger action to confront openly the historical roots of today’s racial disparities and to improve their fiscal policies, as a key part of a broader effort aimed at reducing and ultimately overcoming those disparities.
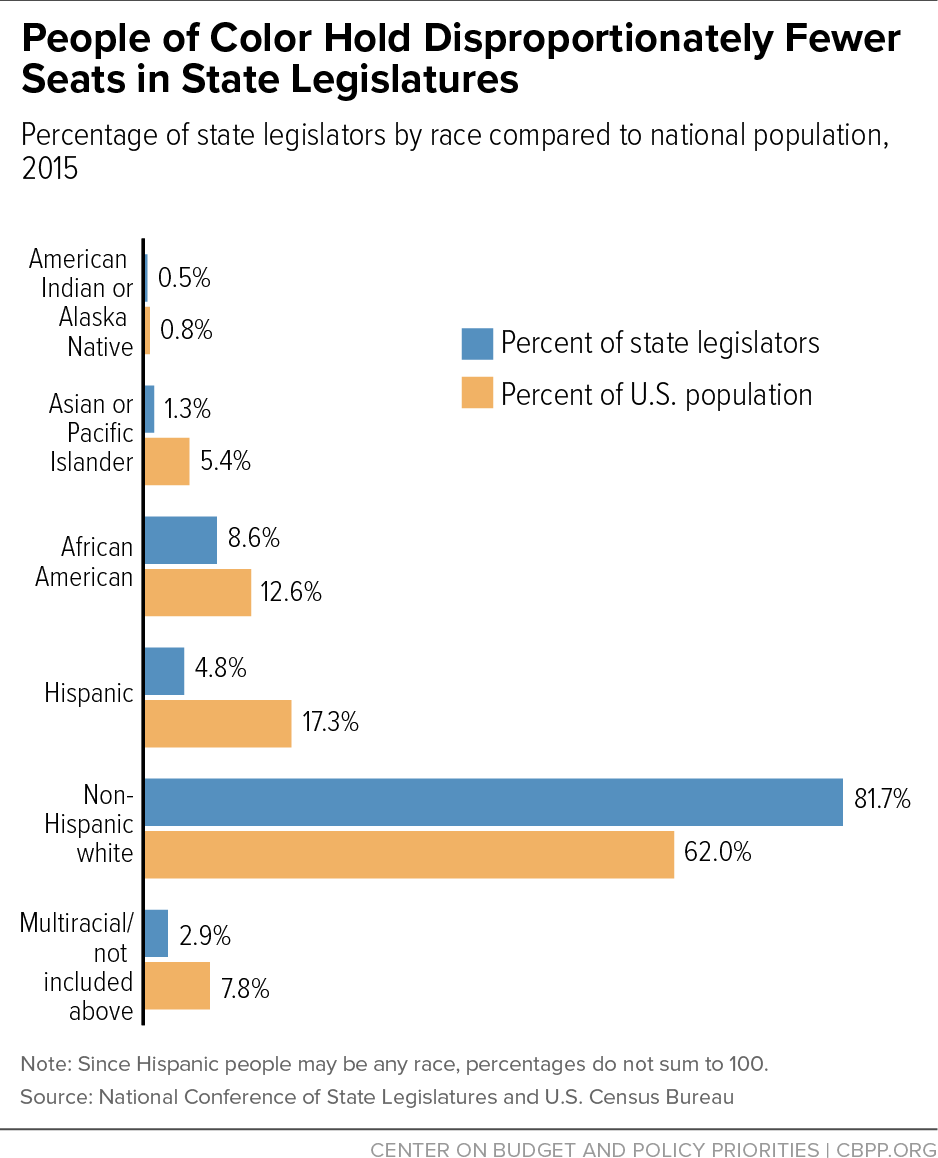
As noted, for much of our nation’s history, people of color had little to no power in state legislatures, which allowed white lawmakers to develop policies that sustained white dominance even in states where people of color were a significant share or even a majority of the population. The vast majority of African Americans in the South were disenfranchised under Jim Crow laws from the late 1800s until the 1960s. As late as 1971, African Americans made up about 11 percent of the nation’s population but only 2 percent of state lawmakers.[32] (Today, African Americans account for about 13 percent of the population and 9 percent of state legislators.) No data are available on the share of state lawmakers in the distant past who were Native American or of Asian or Latinx descent, but there’s little doubt that few state legislators identified themselves as members of these groups. Even today, these groups (Asian, Latinx, and Native Americans) account for only about 7 percent of state lawmakers, despite making up nearly a quarter of the national population.[33] (See Figure 2. For state-specific data, see the Appendix.) People of color are also less likely to hold seats on local government councils, relative to their share of the population. One survey estimated that about 1 in 6 African Americans in the country live in communities where their share of the population exceeds the share of Black people on their local council. Among white people, the ratio is 1 in 66.[34]
Historical Tax Policies That Helped Hold Back People of Color
Given these political and cultural realities, it’s not surprising that state and local tax policies of the past often reflected and advanced the interests of white residents, especially those with the power and resources to influence state lawmakers, at the expense of people of color. During the brief period of Reconstruction after the Civil War, Southern state legislatures provided, for the first time, for schools and other services for African Americans, raising property taxes sharply to do so (as well as to make a range of other needed public investments in the war-torn states).[35] Many white people resisted these measures, often violently. Some of them, the so-called Redeemers, ultimately took power across the South[36] and sharply reduced funding for public services and sought to disenfranchise and otherwise disempower African Americans.
The Oldest Supermajority Requirement to Raise Revenue
In 1890, Mississippi Redeemers wrote a new state constitution that, among other discriminatory changes such as banning interracial marriage, required that people pay poll taxes and pass literacy tests in order to vote. Partly to further ensure white dominance, the Redeemers also reapportioned the state’s legislature, shifting power away from the Mississippi Delta, where most African Americans lived.[37] White households in the Delta, which included many of the state’s wealthiest former slaveholders, strongly supported disenfranchising African Americans; they also worried that the legislature would target tax hikes at them. As protection against this possibility, they demanded — and won — a requirement that any tax increase must secure the votes of at least three-fifths of the members of both houses of the state legislature.[38] This requirement, the oldest among state supermajority requirements for tax increases, remains in force today.[39]
Indeed, the delegate who introduced the supermajority requirement later said of the convention delegates, “All understood and desired that some scheme would be evolved which would effectually remove from the sphere of politics in the State the ignorant and unpatriotic negro.”[40] He was referring to the various provisions aimed at deliberately excluding Black people from voting, but the supermajority requirement that he championed further solidified white dominance, the avowed goal of most convention delegates. While the state’s discriminatory voting restrictions were ultimately overturned decades later by the Voting Rights Act of 1965, the supermajority requirement to raise tax revenue remains in place, adding to the barriers faced by people in Mississippi who seek to raise revenue for school improvements and other public investments that could help improve the lives of the many African Americans in the state.
Early Property Tax Limits Date From Post-Reconstruction
Most of the oldest limits on property tax rates still in effect today also date from the Redeemer period in Southern history.[41] Since property taxes are the primary source of local government revenue, formulaic and tight limits on property tax rates make it much more difficult for localities to provide decent-quality services including schools, parks, and libraries.[42] These limits also encourage localities to rely on other sources of revenue, such as sales taxes and fees, that fall harder on lower-income families.[43] Since people of color are more likely to have lower incomes, this shift in localities’ revenue base tends to produce a shift in who pays for local services, with white people paying less and people of color paying more.
In 1875, Alabama’s Redeemers wrote a new constitution, overturning one written by a biracial group of delegates earlier during the Reconstruction era. Among its many provisions, the new constitution required separate schools for African American children and imposed strict constitutional caps on state and local government property tax rates.[44] These limits were subsequently incorporated into the state’s 1901 constitution, which remains in place.[45]
Installing highly restrictive property tax limits in Alabama’s 1875 and 1901 constitutions protected Alabama’s Redeemers from the possibility that African Americans and their allies could return to power and substantially increase property tax rates to fund education and other such measures. As the historian J. Mills Thornton noted:
During Reconstruction, the experience of [Black Belt] whites had been a county government which was controlled by blacks and their Republican allies and which had very heavily taxed them, and taxed them for purposes that they largely regarded as illegitimate, such as the education of the Freedmen. Now that they had power back into their own hands, they were intent on . . . using that new control to protect themselves from the possibility that the black majority in their counties would ever again be able to use that political power . . . to tax them in a way that would force them as the property holders to cough up the funds, . . . which would be used to the benefit of the majority of the people in the Black Belt who were black and essentially non-property holding. . . . And so they wanted to write into the Constitution permanent protections.[46]
The property tax limits also served other purposes, including helping to attract support for the new constitution from white owners of small farms in northern Alabama who felt particularly harmed by the sharp property tax rate increases imposed during Reconstruction.[47]
Regardless of the delegates’ motivations, the limits further solidified white dominance and made it harder for Black residents to secure needed public investments in their communities. These limits have now been in place for over 140 years, producing a harmful cumulative effect. Today, Alabama’s property tax revenue as a share of its economy is the lowest of any state in the country, seriously hampering the ability of local governments to provide adequate schools and other public services.[48]
And Alabama is not alone. During the Redeemer period, Arkansas, Missouri, and Texas also adopted constitutional property tax limits that remain in force today. Georgia, too, adopted a limit during the Redeemer period, which remained in force for decades but was repealed in 1977.[49]
First Modern Sales Tax Shifts Tax Base Away From White Property Owners
In 1932, Mississippi adopted the nation’s first modern retail sales tax — a tax that generally falls hardest on those with the least income. The state’s governor urged adopting the new tax in part by emphasizing that the revenue would be used to reduce property taxes, and that as a result, the tax would shift the state tax base away from (mostly white) property owners and more heavily onto consumers with little or no property and little else to tax (many of whom were Black). “One of the chief purposes of the sales tax,” he said in a speech before the legislature, “is to decrease the tax burden by broadening the tax base. There are today in Mississippi thousands of people who pay no taxes, but who enjoy all the rights and privileges of citizenship. These people will be glad of an opportunity to share in the responsibility of maintaining the government of the state in which they live.”[50] African Americans did not have an opportunity to express at the ballot box whether that was true, since nearly all of them were barred from voting in 1930s Mississippi.
This is not to say that Mississippi adopted its sales tax solely to shift tax burdens more heavily to Black residents. Like many states during the Depression, Mississippi was deeply in debt and desperate for new revenue, and many of its property owners were in default.[51] The sales tax apparently was attractive to the state’s policymakers both because it promised to bring in a large amount of revenue rapidly and because African American residents would pay a larger share of the taxes.[52] Other states adopted sales taxes not long after Mississippi demonstrated the tax’s feasibility and its significant revenue-raising power.[53]
Still, it’s not possible to separate Mississippi’s adoption of the first modern sales tax from the context of racial discrimination in which it occurred. The tax required African American residents to pay more as a share of their income than white residents, and it helped hold down property taxes that were paid primarily by white people. The tax thus reinforced racial inequities in a state where Jim Crow laws and various forms of violence and intimidation were pervasive.
The racially disparate effects of Mississippi’s sales tax continue today. The lowest-income fifth of Mississippi households pays about 10.2 percent of its income in state and local taxes, on average, while the highest-income 1 percent of households pays about 6.7 percent of its income in these taxes.[54] This disparity is due almost entirely to the state’s heavy reliance on the sales tax, which accounts for three-quarters of the state and local taxes that the poorest Mississippi households pay. With African American residents in Mississippi more likely than white residents to have low incomes, the disparate impact of the sales tax adds to the policy-driven barriers that Black people face.
Explicitly Racist Fiscal Policies of the Past
While the policies discussed above had, and continue to have, racially harmful effects, race was not an explicit factor in determining the amount of tax that residents paid, and white and Black residents have faced the same sales tax rates. Some states and localities, however, did use race explicitly in defining how much individual taxpayers would pay, with deliberately discriminatory results. These policies are no longer on the books and are recognized today as legally impermissible, but at the time they had significant, harmful effects on people of color.
The history of school funding is rife with examples of states and localities using tax-and-spending policies and practices to advantage white families at the expense of children and families of color, at times openly and explicitly. For example, at the turn of the 20th century, Kentucky allocated property taxes to its racially segregated schools based on taxpayers’ race: schools attended by white children received all of the property taxes paid by white residents, while schools attended by Black children received only the taxes paid by Black families. Since Black families in Kentucky had far less property wealth than white families — at that time many Black people were only a generation or so removed from slavery — this ensured that Black children would attend separate and very unequally funded schools.[55] Other Southern states produced a similar result by distributing funds to districts regardless of race but allowing local officials to direct most of the funding to segregated schools for white children.[56]
Another historical example of explicitly racist state fiscal policies comes from California. During the gold rush years of the 1850s, California imposed a special tax on immigrant miners. (U.S.-born whites were not subject to the tax.) The tax fell on immigrant miners of European descent as well as those from China and Latin America, but for a period in 1855 and 1856, the state imposed an additional tax solely on immigrant miners ineligible for citizenship, mainly Chinese and Latinx miners who were legally barred from becoming U.S. citizens because they were not “free white persons.” The tax was a major revenue source for California at the time; it raised over a quarter of the state’s revenue in 1856.[57]
Tax Policy Administration Also Held Down People of Color
Racial discrimination in state and local tax policies historically has occurred not only through the policies themselves but also through how tax authorities administered those policies. For example, property assessment for tax purposes is an arcane and often opaque process, conducted by taxing authorities who control the information required to make assessments of property values and to judge whether those determinations are fair. In the rural South during the Jim Crow era, these authorities were typically white politicians representing the interests of overwhelmingly white voters, since nearly all Black people were blocked from voting.[58] These politicians often over-assessed property owned by African Americans and under-assessed property owned by white residents. As historian Andrew Kahrl writes:
Whether or not they knew it or could prove it, black property owners in the Jim Crow South were often taxed at a higher effective rate than their white counterparts to support public institutions and services that African Americans were denied access to (or were provided on a separate and unequal basis) and to pay the salaries of public officials who did not represent and were unaccountable to black citizens. In short, African Americans were taxed more for less.[59]
States and local governments could also use tax assessments as a political tool to sustain the status quo by punishing Black people who protested Jim Crow laws or other discriminatory systems. For example, in 1966 the white-dominated government of a Mississippi town selectively raised the property assessments of Black people participating in a boycott of white-owned businesses (which was prompted by the town’s refusal to integrate a local swimming pool). In one year, Black property owners in the town saw their assessments increase by more than 50 percent overall.[60]
Some local property assessors in the North also produced discriminatory assessments.[61] A 1973 study conducted for the U.S. Department of Housing and Urban Development found that properties in low-income African American neighborhoods in Baltimore, Chicago, and Philadelphia were subject to a much higher effective tax rate than properties in middle-class white neighborhoods, “due principally to neighborhood bias in assessments.”[62] Similarly, historian Andrew Kahrl reports that in 1970s Chicago, the county tax assessor’s office tended to over-assess properties owned by African Americans. One reason was that when neighborhoods transitioned from white to Black, property values declined (because white people, a large share of the housing market, no longer wanted those homes), yet tax assessments did not account for this decline in value. There may not have been an intention to overtax Black homeowners, but that is what occurred. And a number of these African American homeowners could not pay their taxes and lost these homes to predatory lien-buyers, who took advantage of laws making it relatively easy for them to seize people’s homes when a property tax bill was overdue.[63]
State and Local Fiscal Policies Could Be Powerful Force for Dismantling Racial Barriers
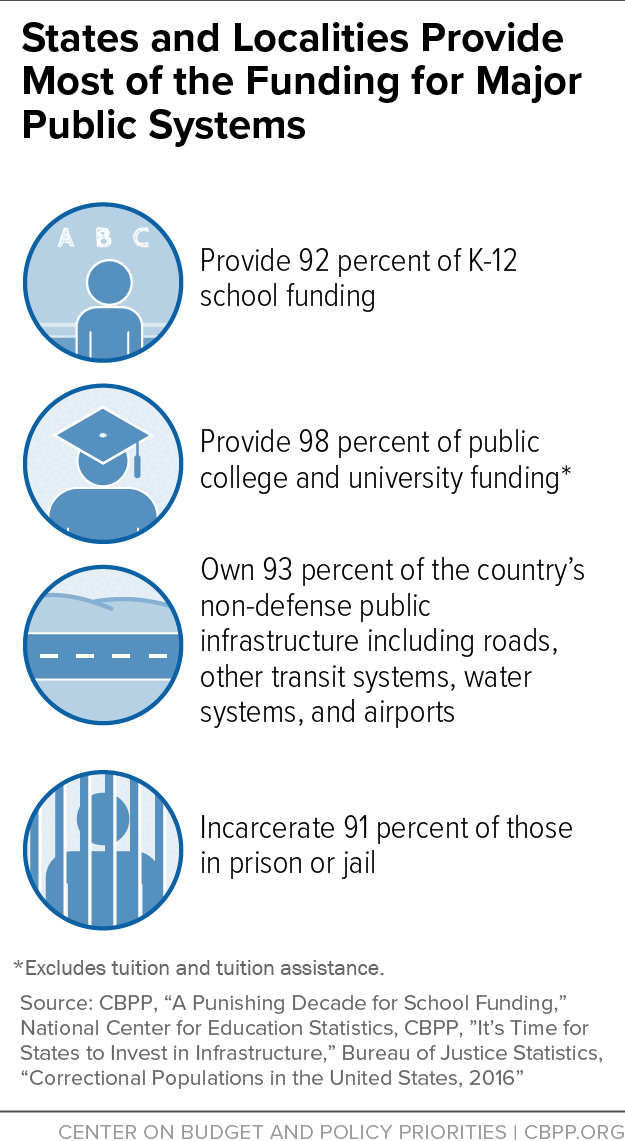
States and localities collect roughly one-third of the nation’s taxes, and they account for nearly half of all domestic public-sector spending. They also provide over 90 percent of K-12 school funding and nearly all public college and university funding, own over 90 percent of the country’s non-defense public infrastructure (roads and other transit systems, water systems, airports, and the like), and incarcerate over 90 percent of the nation’s prisoners. (See Figure 3.) Given that level of economic power, states could be a potent force for expanding opportunity and enhancing equity. How states choose to raise revenue and how (and where) they choose to spend it has major implications for who moves ahead and who is left behind.
State fiscal policies can, and often do, help to promote opportunities and enhance equity. For example, some states tax high incomes or large inheritances and use some of that revenue to target college scholarships to low-income students, or to finance medical care for low-income children. One example is Minnesota, which in 2013 adopted a new income tax rate on very high incomes and used the revenue in part to help more low-income children attend high-quality preschool programs.[64]
But states could be doing much more through their fiscal policies to reduce racial and ethnic income disparities, reduce poverty, and expand economic opportunity. While the specific needs of states vary, lawmakers can pursue fiscal policies that tax the best-off households to a greater degree than households with low or modest incomes, raise revenue for investments that can help overcome racial inequities — including investments that help low-income families and children of all races — and remove artificial revenue-raising constraints such as supermajority requirements to raise taxes.
Shift Inequitable Taxation to a System Based on Ability to Pay
State and local tax systems typically worsen racial and ethnic inequities. In 45 of 50 states, state and local tax systems effectively require lower-income households to pay a larger share of their income in taxes than high-income households. And since households of color are more likely to have low incomes, they tend to pay larger shares of their incomes in state and local taxes than white households do.
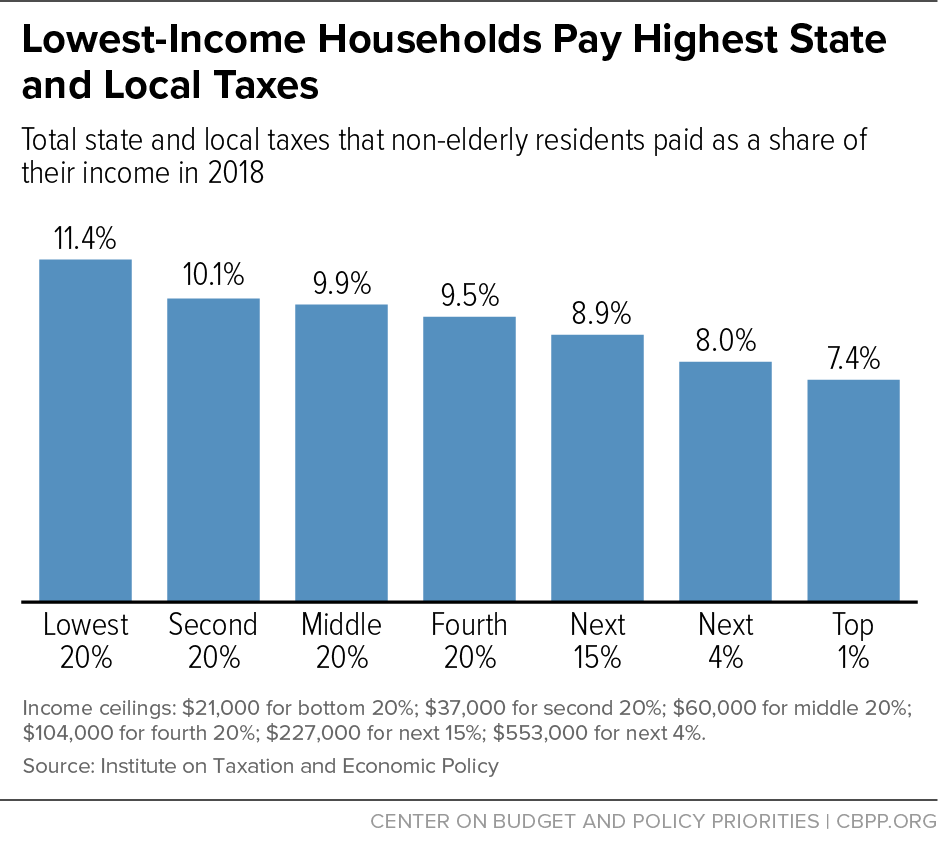
Nationally, the poorest fifth of households pay a much larger share of their income in state and local taxes than the top 1 percent, on average. (See Figure 4).[65] In some states, this disparity is especially stark. In eight states, the poorest fifth of households pays three times more of its income, on average, than the richest households do. In Washington State, Florida, and Nevada, the poorest fifth pays five times more of its income in taxes than the top 1 percent does.[66]
To address this problem, states should take the following types of steps.
Strengthen State Income Taxes
Income taxes are the only major source of state and local revenue that is based on a taxpayer’s ability to pay. It’s not surprising, then, that many of the states with particularly inequitable tax systems — including Florida, Nevada, Tennessee, Texas, and Washington — all lack a broad-based income tax. Other states with especially inequitable systems, such as Illinois and Pennsylvania, have flat-rate income tax systems, under which tax rates do not rise with income. The states with overall tax systems that are based on ability to pay — California, Delaware, Minnesota, New Jersey, and Vermont, along with the District of Columbia — have relatively robust income taxes.[67]
Some states have taken steps in recent years to increase income taxes for very high-income households. Four states — California, Connecticut, New Jersey, and New York — plus the District of Columbia now have tax brackets for income over at least $500,000, and other states, including Hawaii, Maryland, Minnesota, Oregon, and Vermont, have top brackets for income over at least $250,000 for joint filers.[68]
On the other hand, the 2010 elections swept in a wave of governors and state legislative leaders who, with the assistance of groups such as the arch-conservative American Legislative Exchange Council, engaged in a sustained and unprecedented attack on state income taxes. These political leaders and conservative activists called for eliminating state income taxes in states such as Kansas, Louisiana, Maine, Michigan, Mississippi, Nebraska, North Carolina, Ohio, Oklahoma, and South Carolina. Five states — Kansas, Maine, Ohio, North Carolina, and Wisconsin — succeeded in passing especially large income tax cuts. Two states — Kansas and Michigan — enacted tax cuts slated to take place in coming years that would ultimately eliminate the state income tax altogether. (In 2017, Kansas repealed a portion of these tax cuts, including those scheduled for future years.)
In recent years, national proponents of eliminating state income taxes have targeted Southern states in particular. Two leading proponents, Arthur Laffer and Stephen Moore, wrote in 2013, “We predict that within a decade five or six states in Dixie could entirely eliminate their income taxes. This would mean that the region stretching from Florida through Texas and Louisiana could become a vast state income-tax free zone.”[69]
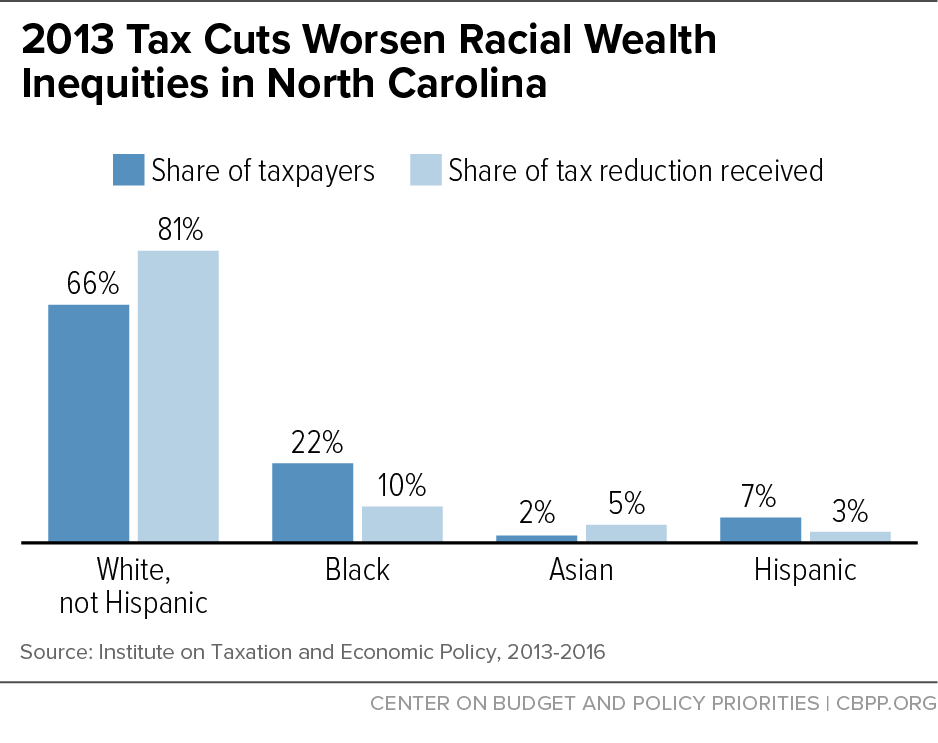
These attacks on state income taxes have only succeeded to a degree. But the attacks that did bear fruit have made racial inequities worse. The 2013 tax cuts in North Carolina, for example, reduced the taxes of the highest-income state residents by 1.5 percent of their income on average, but by just 0.1 percent of income for the lowest-income North Carolinians, according to the Institute on Taxation and Economic Policy. White North Carolinians comprise two-thirds of state taxpayers, but received 81 percent of the tax cuts. In contrast, Black North Carolinians comprise 22 percent of state taxpayers but received 10 percent of the tax cuts. (See Figure 5.) Black residents now pay a larger share of state taxes than before, while white residents pay a smaller share. People of Hispanic or Latinx heritage also pay a larger share than before. People of Asian heritage pay somewhat less.
States can improve their personal income tax systems in a variety of ways. Some states need to reverse course on excessive income tax cuts enacted in the past. Others need to reject flat-rate income taxes in favor of a system based more on the ability to pay. Still others have a range of options to consider, including adopting new top brackets on high incomes, capping itemized deductions, and eliminating or restructuring misguided tax breaks that lose needed revenue while increasing racial and economic inequities, such as provisions that offer a lower tax on income from capital gains or “single sales factor” provisions that allow large, multistate corporations to escape much of the corporate income tax that they otherwise would be required to pay to a state.[70]
Improve the Taxation of Wealth
Since the 1970s, wealth has become increasingly concentrated in the hands of a relatively small share of households in the United States. Data from the Federal Reserve’s Survey of Consumer Finances show that the wealthiest 1 percent of households control about 40 percent of national wealth, while the bottom 90 percent hold roughly only about half of that. Families of color face particularly high barriers to accumulating savings and buying homes or other assets. As noted earlier, the median net worth of white families is more than ten times that of Black families and eight times that of Latinx families.[71]
State and local governments could do a much better job of using tax policy to lessen barriers to more broadly shared prosperity, especially barriers caused or exacerbated by the high concentration of wealth in the United States. Wealth taxes — such as inheritance taxes on the transfer of wealth, or property taxes on high-end homes and mansions — along with higher taxes on the incomes of very wealthy households would raise revenues for education, health care, job training, and other measures that can boost the prospects of those left behind in today’s economy.
Currently, the estate tax is the only major state tax that is paid almost entirely by the wealthy. Yet the large majority of states lack such a tax. Only the very wealthiest taxpayers pay estate taxes where such taxes exist; in the states with such a tax, only 2.56 percent of estates, on average, owe any tax at all.
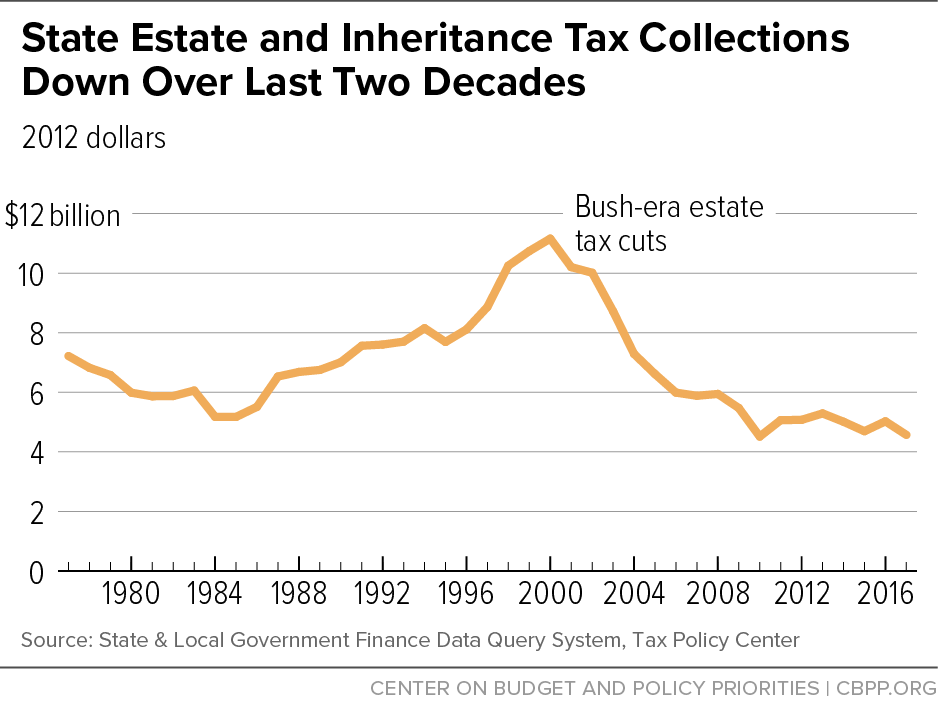
A concerted attack on estate taxes over the last two decades — most significantly, the elimination under President George W. Bush of a federal tax credit that supported state estate taxes by providing a credit for those taxes against any federal estate tax owed — has resulted in a sharp drop in the number of states with the tax. In 2000, every state had an estate tax. Today, just 12 states plus Washington, D.C. do, while another five have an inheritance tax on the income of heirs.[72] As a result, state estate and inheritance tax collections have plummeted since enactment of the Bush tax cuts in 2001. (See Figure 6.)
States with an estate tax can avoid further increasing inequality by resisting calls to reduce or eliminate the tax.[73] States without an estate tax can reduce overall inequality and lessen racial inequities by adopting such a tax.[74] Other options for improving how states tax wealth include increasing tax rates on capital gains, expensive homes, or luxury items.
Adopt or Expand State Earned Income Tax Credits
Due largely to various structural barriers to opportunity, African American and Latinx workers are far more likely than white workers to earn poverty-level wages.[75] One step that states can take to lessen this inequity is to adopt or expand state Earned Income Tax Credits (EITCs), which can help address the disparate racial impact of regressive taxes like sales taxes by boosting the after-tax incomes of low-wage households struggling to make ends meet. These state tax credits build on the success of the federal EITC in part by helping working parents pay for things that allow them to be employed, like child care and transportation. And while state and federal EITCs serve a larger number of white households than of households in any other racial or ethnic group (because there are more white households in the United States), they serve a larger proportion of people of color. EITCs also have a disproportionate impact in reducing poverty rates among households of color.
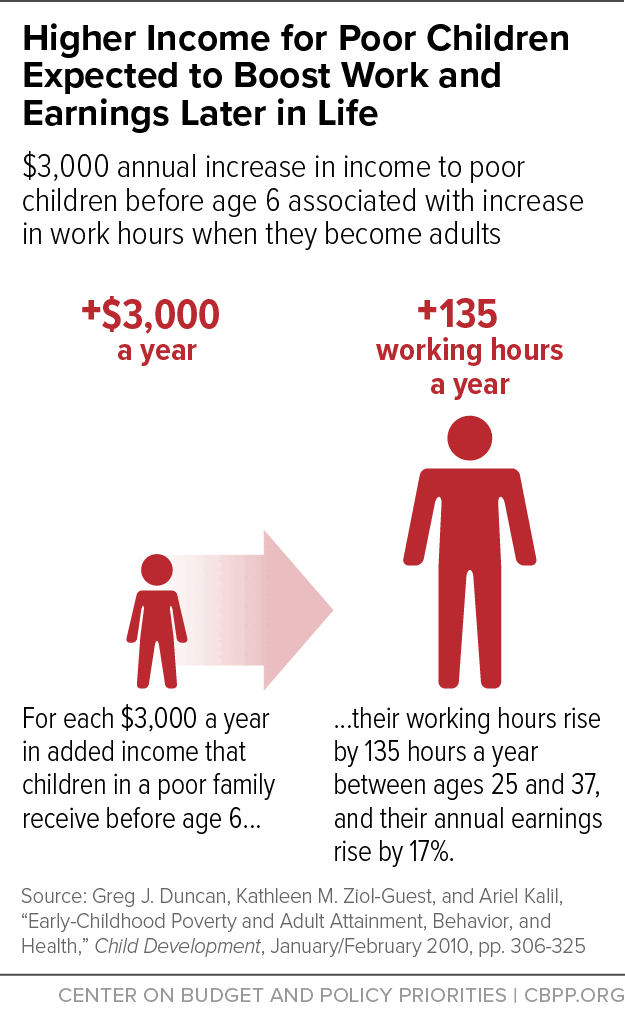
State EITCs also build on the federal EITC’s well-documented, long-term positive effects on children. That’s a key reason why the credit helps advance racial and ethnic equity, since child poverty is nearly three times higher for African American and Hispanic children than for white children.[76] Multiple studies find that young children in low-income households that receive an income boost, including from policies like a state or federal EITC, tend to do better and go further in school, reducing the disadvantages associated with exposure to poverty.[77] (See Figure 7.) The EITC may play a particularly important role in helping children of color improve their math achievement, complete high school, and enroll in college, the research suggests.[78]
Some 29 states and the District of Columbia today have state EITCs. The 21 states without state EITCs should adopt them, and many states with EITCs should consider expanding them. For the six states with nonrefundable EITCs (in which a taxpayer’s EITC cannot exceed the state income tax that the individual owes and thus cannot serve as a wage supplement), the first step should be to make the credits refundable. This would give low-income working households in these states the full value of the tax credit for which they qualify, irrespective of whether the tax credit exceeds their state income tax liability. Moving to refundable credits would particularly help households of color, given their disproportionate concentration at the lower end of the income scale.
States that already have refundable EITCs can increase the size of the credit. In particular, they can expand the credit for workers without children in the home, as those workers currently receive only a very small or no federal EITC.
Eliminate Courtroom Fees for Low-Income People, Reform Use of Fines
The issue of criminal justice fines and fees began to receive wider public attention after the U.S. Department of Justice found that the criminal justice system in Ferguson, Missouri was heavily driven by revenue needs rather than public safety. To support its budget, the city relied upon increasing amounts of revenue from various kinds of fees and fines imposed disproportionately on low-income African American residents.[79]
Beyond Ferguson, research has found widespread use of fines and fees that can cause long-lasting harm for individuals — often poor people of color — trapped within cycles of debt and criminal justice involvement.[80] In recent years, many local governments have become more reliant on these revenues, in part because state financial support for municipal services has eroded, and have become less inclined to adequately finance their justice systems through local tax levies.[81]
Courts often remain wedded to widespread reliance on fees and fines because it can provide a predictable amount of funding outside of the state and local government appropriations process. In some instances, courts and localities may look more to fines and fees revenue today in part because, as noted, states have reduced aid for localities and/or imposed new restrictions on localities’ ability to raise revenue such as through state-imposed property tax limits.
Those ensnared in the system — often low-income people of color — bear the highest cost. One study found that cities with larger Black populations rely more heavily on fines and court fees. (The effect was somewhat ameliorated if the city had at least one Black city council member.)[82] But incarceration is costly, and all taxpayers pay when the police arrest and jail people who have outstanding warrants because they can’t afford to pay their fines and fees.
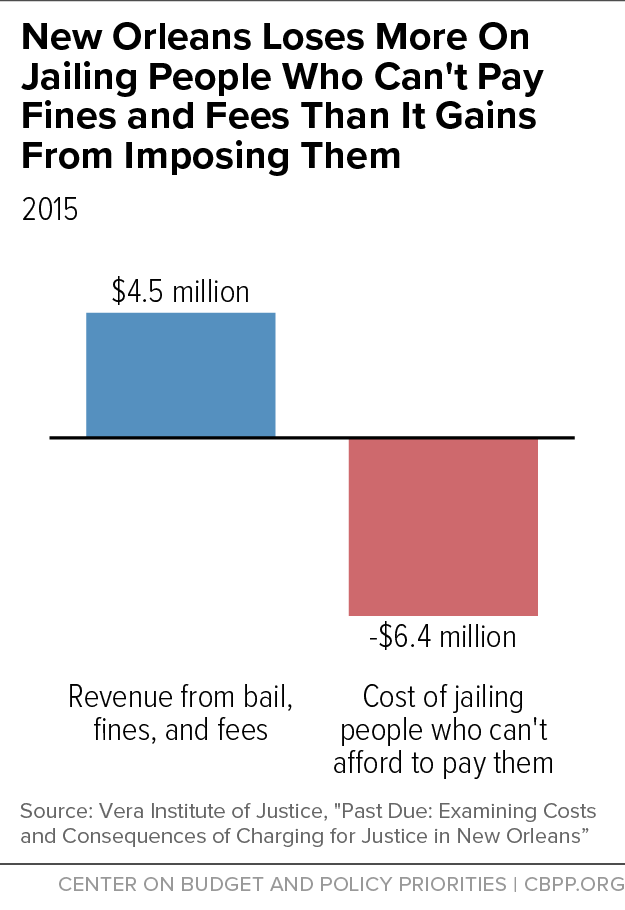
Ending the use of fees charged for defendants’ use of courts and other resources, and reforming the use of fines that are imposed as part of a person’s sentence, should produce substantial benefits for low-income people at a relatively small cost to the government. One study in New Orleans found that in 2015, the disproportionately poor individuals who passed through the city’s justice system paid $4.5 million to the government in fees, fines, and bail, while the city paid $6.4 million to jail people who couldn’t pay these costs.[83] (See Figure 8.)
Raise Revenue to Invest in Overcoming Racial and Ethnic Inequities
State and local economies generally perform better when they maximize the human capital available to them, which entails adequate public investment in education, job training, transportation, and the like. Having good schools in every community offers children from lower-income families a chance at a better future, while providing more skilled workers for local economies. Affordable colleges and universities also boost opportunities, especially for students of color.[84]
In addition, family economic supports help parents struggling on low wages to provide their children with stable housing, nutritious food, and less stressful home lives. Child care subsidies enable more low-income parents to work. Health coverage protects families from bankruptcy due to a health emergency or chronic illness and enables businesses to have healthier, more productive workers.[85] When these kinds of public investments receive adequate resources and are administered effectively and with equity in mind, they can help lessen barriers to opportunity for many people of color, helping more Americans achieve their dreams to the benefit of the broader economy.
States need to raise enough revenue to invest adequately in their residents. Today’s state and local tax systems, however, generally are inefficient, built for a different era, and often incapable (as now structured) of raising enough funds even to keep pace with the rising costs of maintaining existing service levels. Overcoming these weaknesses and building more modern, adequate revenue systems will require a range of improvements, including the following steps:
- Building stronger personal income tax systems. With income inequality at extremely high levels, today’s state personal income tax systems should be designed to capture more of the income at the top. Reforms like those outlined in the previous section can help strengthen state income tax systems so they raise more adequate amounts of revenue. This is particularly important because income tax revenue tends to grow with the economy over time. As such, stronger income taxes help ensure that states have sufficient money to pay for services as time goes on, without having to regularly seek to raise tax rates.[86]
- Eliminate wasteful subsidies that allow corporations to avoid paying taxes on their profits. States should regularly monitor and evaluate economic development subsidies and eliminate ineffective ones. These subsidies, designed to encourage various types of business activity or to entice businesses to locate or remain in a state or locality, now cost state and local governments tens of billions of dollars each year, even though on the whole they have not been effective at reducing unemployment, raising incomes, or growing state economies.[87]
More broadly, states should scrutinize the billions of dollars they essentially spend each year through the tax code in the form of tax credits, deductions, and exemptions. For the most part, policymakers don’t regularly examine these “tax expenditures” for effectiveness in the way that they examine yearly budget appropriations. A state agency generally has to make its case to the governor and legislature each year for the level of funding that it seeks to serve state residents. But tax breaks for certain types of businesses can continue (and even grow in cost) from year to year without much or any scrutiny or debate.
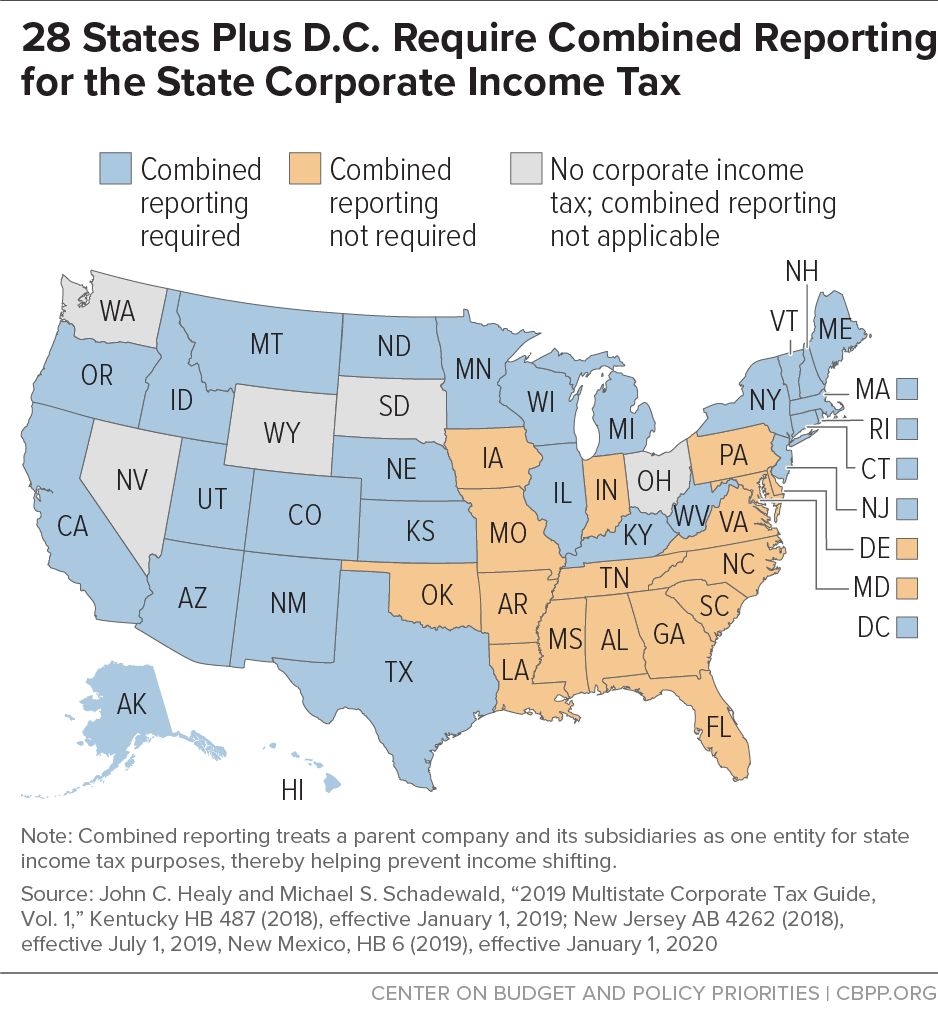
States can nullify a variety of tax avoidance strategies employed by large multistate corporations by adopting a reform known as “combined reporting,” which treats a parent company and its subsidiaries as one entity for state income tax purposes, thereby minimizing companies’ ability to shift income earned in a state to other states that are tax havens (like Delaware and Nevada).[88] (See Figure 9.) In addition, by adopting a reasonable minimum corporate tax, states can ensure that every corporation operating in the state pays at least a reasonable minimum tax to support the public investments that undergird a thriving private economy. States also can consider raising tax rates on corporate profits, particularly states where such tax rates have been sharply reduced in recent years.
- Modernizing state sales taxes. While sales taxes fall particularly hard on low-income people, they are a major source of revenue for state investments, including schools and health care, that can increase opportunities and advance racial equity. As part of a revenue system that’s based overall on a taxpayer’s ability to pay, sales taxes can help states raise adequate funds.
Many states levy sales taxes primarily on tangible goods while applying the tax to few services. Yet services, many of which (such as video streaming) didn’t exist when sales taxes were first enacted, make up a growing share of consumption. States can halt the erosion of their sales taxes and improve their long-term ability to invest in state priorities by broadening the sales tax to include more services.[89] States should also take advantage of new authority that the Supreme Court granted them in its 2018 Wayfair decision to require all large Internet businesses to charge sales taxes on online purchases; the failure of Internet sellers to collect and remit state and local sales taxes has cost states billions of dollars each year. Similarly, many states don’t require online travel companies like Expedia, Orbitz, and Priceline to collect and remit the appropriate taxes on hotel-room bookings.[90]
- Taxing carbon pollution and resource extraction. Carbon pollution is causing global temperatures to rise, with harmful consequences that include more droughts, rising sea levels, and more severe weather, all of which can adversely affect the economy. A carbon tax or other method of “putting a price on carbon” can generate revenue for critical investments while also reducing carbon pollution.
Low-income communities — disproportionately communities of color — often bear the brunt of carbon pollution’s negative environmental effects. At the same time, low-income households would be hit harder than other households by taxes on carbon pollution; such taxes would consume a larger share of their incomes because they spend a bigger share of their income on energy and energy-related products than do higher-income households.[91] But states can design carbon tax measures so that a portion of the revenue is used to fully offset the hit to lower-income households, and to cushion the impact on many other households as well, while still leaving substantial revenue for other beneficial uses.[92] In addition, states that levy severance taxes on resource extraction may be able to increase these taxes to help fund priorities like education, health, and infrastructure.[93]
States may need to raise revenue in coming years not only to pay for existing services but also to make up for cuts that could be made in federal funding for state and local priorities. Federal aid to states and localities through federal programs other than entitlements already is at historically low levels, measured as a share of the economy.[94] And under caps enacted in 2011 on total federal funding for non-defense programs that are not entitlements, those aid levels will decline further if the President and Congress do not reach a new bipartisan agreement in 2019 to ease those caps. In addition, federal policymakers could seek to enact further cuts in the future to reduce mounting federal budget deficits.
State efforts to raise taxes that high-income households and corporations pay are particularly justified in the wake of the federal tax changes enacted at the end of 2017, which provide a windfall for many corporations and very high-income households. In 2018 alone, the top 1 percent of taxpayers will receive about $80 billion in federal tax cuts as a result of these changes.[95] In 2025, when the new tax-cut law will be fully phased in (and before many of its provisions are scheduled to expire), it will boost the after-tax incomes of households in the top 1 percent by 2.9 percent, which is roughly triple the 1.0 percent gain for households in the bottom 60 percent, according to the Tax Policy Center.[96] In dollar terms, the disparity is even greater. Those in the top 1 percent will receive federal tax cuts averaging $61,100 in 2025, while the tax cuts going to the bottom 60 percent will average about $400. Through state tax reforms, states could recoup some of this windfall to invest in measures that can make the benefits of economic growth more broadly shared, while reducing racial and ethnic inequities.[97]
Raising adequate revenue and investing it wisely is one step toward more vibrant and equitable economies. Part of this entails targeting sufficient investment to low-income communities, particularly communities of color harmed by historical and structural racism. There are many examples of how states can target spending to improve the lives of people in low-income communities of color. To take one, states can reform the funding formulas they use to support K-12 schools to provide more funding to schools serving large shares of children living in poverty or facing other challenges.[98] They can also reform criminal justice systems to shift a significant share of spending on incarceration to more productive investments targeted to the communities harmed the most by the overly aggressive policing and sentencing practices of recent decades, which led between 1980 and 2010 to a 350 percent increase in the likelihood of going to prison for a drug-related crime.[99]
Improve the Fiscal Policy “Rules of the Game”
The capacity of states and localities to address racial and ethnic inequities is limited by often-arcane legal restrictions on their ability to raise revenue and manage their finances effectively. These rules sometimes weaken legislatures by investing power in arbitrary formulas or by giving small minorities of lawmakers undue power. As such, states should improve their fiscal policy “rules of the game” in ways that support more democratic decision-making, such as by eliminating supermajority requirements for raising revenue, reforming or repealing rigid, formulaic limits on property taxes, and overturning other harmful restrictions on state budgets that weaken the authority of state lawmakers to manage state finances.
- Eliminating supermajority requirements to raise revenue. Sixteen states require a supermajority vote of both legislative houses to enact at least some tax increases.[100] The specific rules vary by state; in some cases, the requirement applies only to certain types of tax increases. But in nine states, the constitution requires supermajority approval for the legislature to enact any major tax increase. Moreover, in seven of these nine states, the supermajority requirement applies even to narrowing or eliminating tax breaks, including unintended tax loopholes that policymakers never sought to create. Of these seven states, three — Delaware, Mississippi, and Oregon — require a three-fifths vote in each legislative chamber, while the other four — Arizona, California, Nevada, and Louisiana — require a two-thirds vote.[101] Beginning January 8, 2019, Florida will join the states that require a two-thirds vote to enact a tax increase, including narrowing or eliminating tax breaks.[102]
These requirements make it considerably more difficult to eliminate a tax break than to adopt one, undermining states’ ability to properly manage their finances when tax breaks turn out to be much more expensive than expected or when tax lawyers and accountants find ways to exploit new state tax laws by creating loopholes that policymakers hadn’t envisioned.[103] These requirements also can result in damage to a state’s credit rating, making it more expensive for the state to borrow to invest in public infrastructure improvements, since credit rating agencies generally consider a supermajority requirement to be harmful to a state’s ability to raise revenue when needed.[104] Such requirements also can encourage wasteful fiscal decisions by handing disproportionate power to a minority of lawmakers, who can hold out for special favors to win their votes. A commission that studied the impact of California’s now-defunct supermajority requirement to pass budgets, for example, found that the requirement resulted in substantial “pork barrel” spending.[105]
- Repeal or reform rigid, formulaic property tax limits. African American and Latinx homeowners tend to pay higher effective property tax rates than white homeowners, in part because past government actions segregated African Americans in lower-value jurisdictions. Because values are lower in these jurisdictions, tax rates must be higher for the local government to collect as much revenue per capita as higher-value jurisdictions. And since past government policies helped segregate neighborhoods by race and so are partly responsible for these inequities, it would be appropriate for today’s public policies to help overcome the racial bias that remains embedded in today’s effective property tax rates. Instead, however, property tax limits tend to reinforce these inequities.[106]
Property tax limits take a variety of forms. Some constrain the percentage by which assessed values can grow each year, others limit the property tax rate, and still others — the most severe — limit the percentage growth in property tax revenue each year. In general, the dollar savings from a property tax limit typically are greater for owners of high-value homes, who are more likely to be white (due in part to policies that impeded African American households from buying homes in higher-value jurisdictions). Those greater dollar savings for white households increase racial gaps in income and wealth. Disparities also grow when property values rise more quickly in areas with more high-value homes, increasing the relative value of a property tax limitation.
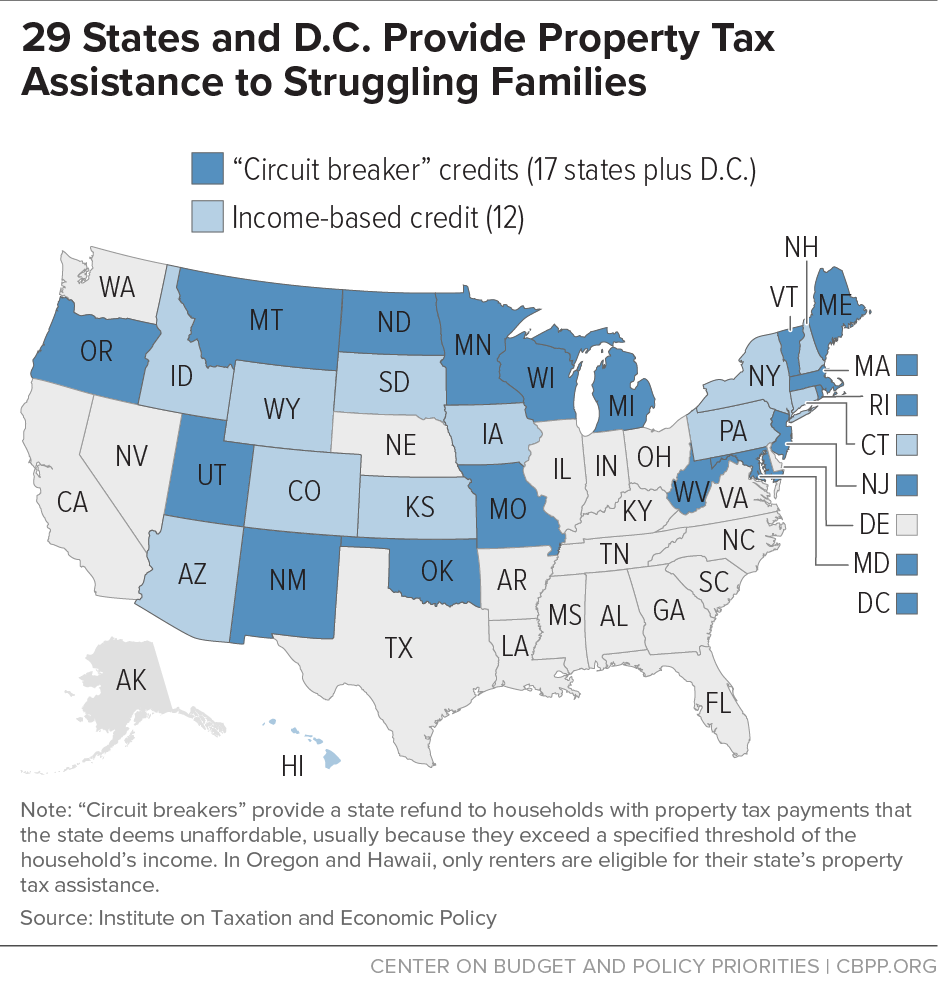
Better alternatives are available to states to relieve property taxes for middle- and low-income taxpayers and seniors who might have difficulty affording the taxes. For instance, “circuit breakers” provide a refund from state revenue to households whose property tax payments are deemed unaffordable, usually because they exceed a specified proportion of the household’s income. Circuit breakers allow the property tax to continue funding essential services like education while targeting tax relief to those who need it.
In 2017, some 17 states and the District of Columbia used circuit breakers, and 12 other states provided property tax credits to some low-income families based on their income.[107] (See Figure 10.) However, many circuit breaker programs are only available to elderly residents or those with a disability, or to very low-income households. States could make far greater use of this strategy to extend property tax relief to overburdened middle- and low-income households. In conjunction with relaxing or eliminating a property tax limit, states could create or improve a circuit breaker to cover all residents whose property tax exceeds a specified proportion of their income. The vast majority of the benefits would go to low- and middle-income households.
- Eliminating other constitutional restrictions on raising revenue. Tight revenue-growth restrictions set in a state’s constitution, including those that limit a state’s revenue growth to a modest annual percentage or that limit revenue growth in any year to the rate of inflation and population growth (as Colorado’s Taxpayer Bill of Rights does) can ultimately result in sharply inadequate revenues. Such restrictions can lead over time to deterioration of needed public programs and services and a corresponding increase in barriers to economic opportunity by race and ethnicity. Such limits, for example, generally don’t allow revenue to keep pace with the growth of health care costs, which account for more than one-sixth of states’ expenditures from their own revenue. These restrictions also can make it extremely difficult for states to adequately fund their outstanding pension liabilities or to meet other needs when costs in some areas (like health care) grow more rapidly than the state’s tax limit, squeezing the remaining portions of the budget. The relatively weaker economic standing of communities of color makes such limits particularly harmful to them, because communities of color may be less able to raise local revenue to make up for limited state revenue, and because their lower incomes and wealth may cause them to be hit harder by cuts in economic supports and services.
Further, writing revenue limits into a state’s constitution can severely limit elected officials’ ability to respond to unusual circumstances or emergencies. At a time when threats could come from a national financial meltdown, an epidemic, a terrorist action, an extreme weather event, or another unforeseen disaster, it is important to preserve state lawmakers’ flexibility to act quickly and adequately to protect their residents. Communities of color already have relatively little representation in their state capitals. These restrictive “rules of the game” further limit their ability to influence critical decision-making.
- Strengthening state “rainy day funds” and improve the rules governing them. States can build up budget reserves to sustain public investments during recessions, helping the economy during difficult times and limiting the harm to families and communities. Strong “rainy day” funds are particularly important to low-income communities of color, since these communities are often the first to feel the harm of budget cuts in recessions and the last to recover from economic downturns.
States can build stronger reserve funds, such as rainy day funds, that they can use to smooth the ups and downs of tax collections when a recession hits. States can use increases in tax collections in robust economies to boost those reserves. A portion of income tax (or other tax) revenues that rise rapidly in good times can be deposited in a rainy day fund for use during economic downturns. Reserves can also be set aside to help localities hit hard by a downturn, whether caused by a recession or some other kind of economic dislocation. For example, a city or local area experiencing industrial decay or the rapid decline of a major source of employment that undermines the area’s vitality could be helped by state funds that enable it to maintain services, invest in job training for new jobs, or support subsidized employment.
In many states, however, arcane rules limit the ability of states to build adequate reserves or to tap their reserves when they need to.[108] Most states cap their rainy day funds at inadequate levels, such as 10 percent of the budget or less. This isn’t an adequate level for even a medium-sized recession. In addition, other rules require some states to replenish their funds after a recession before they are able to do so, require supermajority votes of the legislature to access the funds, or otherwise unduly limit how states may use the funds. Many of these rules harm the ability of states both to build adequate reserves in good times and to use their reserves wisely when needed. As such, these rules weaken state rainy funds despite the importance of such funds in protecting communities, especially low-income communities of color, during recessions, natural disasters, or other difficult times.
| APPENDIX TABLE 1 | ||||
|---|---|---|---|---|
| Proportion of Non-Hispanic White State Legislators Exceeds Their Population Share in 46 of 50 States, 2015 | ||||
| State | Non-Hispanic White Population Share | Non-Hispanic White Legislators as Share of All Legislators | Percentage-Point Difference | |
| Delaware | 64% | 90% | 26 | |
| California | 38% | 62% | 24 | |
| Alaska | 62% | 85% | 23 | |
| Texas | 43% | 65% | 22 | |
| Washington | 70% | 91% | 21 | |
| Virginia | 63% | 83% | 20 | |
| Nevada | 51% | 70% | 19 | |
| Georgia | 54% | 72% | 18 | |
| Massachusetts | 74% | 92% | 18 | |
| Louisiana | 59% | 76% | 17 | |
| New Jersey | 57% | 74% | 17 | |
| New York | 56% | 73% | 17 | |
| Oregon | 77% | 94% | 17 | |
| Arizona | 56% | 71% | 15 | |
| Arkansas | 73% | 88% | 15 | |
| Maryland | 52% | 67% | 15 | |
| North Carolina | 64% | 79% | 15 | |
| Oklahoma | 67% | 82% | 15 | |
| Colorado | 69% | 83% | 14 | |
| Florida | 56% | 70% | 14 | |
| Minnesota | 81% | 95% | 14 | |
| Mississippi | 57% | 71% | 14 | |
| Rhode Island | 74% | 88% | 14 | |
| Illinois | 62% | 75% | 13 | |
| North Dakota | 86% | 99% | 13 | |
| Pennsylvania | 78% | 91% | 13 | |
| Wyoming | 84% | 97% | 13 | |
| Idaho | 83% | 95% | 12 | |
| Kansas | 77% | 89% | 12 | |
| Nebraska | 80% | 92% | 12 | |
| New Mexico | 39% | 51% | 12 | |
| South Carolina | 64% | 76% | 12 | |
| South Dakota | 83% | 94% | 11 | |
| Utah | 79% | 90% | 11 | |
| Wisconsin | 82% | 93% | 11 | |
| Tennessee | 75% | 85% | 10 | |
| Alabama | 66% | 75% | 9 | |
| Indiana | 80% | 88% | 8 | |
| Michigan | 76% | 84% | 8 | |
| Missouri | 80% | 87% | 7 | |
| Iowa | 87% | 93% | 6 | |
| Kentucky | 85% | 91% | 6 | |
| Ohio | 80% | 86% | 6 | |
| Connecticut | 69% | 74% | 5 | |
| West Virginia | 92% | 97% | 5 | |
| Vermont | 93% | 96% | 3 | |
| New Hampshire | 91% | 91% | -0.20 | |
| Hawaii | 22% | 22% | -0.40 | |
| Montana | 87% | 86% | -1 | |
| Maine | 94% | 89% | -5 | |
End Notes
[1] Today, 16 states have some form of supermajority requirement to raise revenue, including states with statutory (as opposed to constitutional) requirements. In January 2019, Florida will implement a new constitutional supermajority requirement to raise revenues, expanding an existing requirement that is more narrowly targeted to increases in corporate income tax rates. See Center on Budget and Policy Priorities, “Policy Basics: State Supermajority Rules to Raise Revenue,” updated February 5, 2018, https://www.cbpp.org/research/state-budget-and-tax/policy-basics-state-supermajority-rules-to-raise-revenues.
[2] Today, 44 states and the District of Columbia impose some kind of limit on property taxes. See Iris J. Lav and Michael Leachman, “State Limits on Property Taxes Hamstring Local Services and Should Be Relaxed or Repealed,” Center on Budget and Policy Priorities, July 18, 2018, https://www.cbpp.org/research/state-budget-and-tax/state-limits-on-property-taxes-hamstring-local-services-and-should-be.
[3] For a list of which states adopted retail sales taxes, and when, see W. Bartley Hildreth and James A. Richardson, eds., Handbook on Taxation, Marcell Dekker, Inc., New York, 1999, p. 73.
[4] Racial inequities that impede people of color’s ability to take maximum advantage of their innate abilities can limit overall productivity and economic growth. See Chang-Tai Hsieh et al., “The Allocation of Talent and U.S. Economic Growth,” April 6, 2018, Version 5.0, https://web.stanford.edu/~chadj/HHJK.pdf. One measure of inequity, the racial wage gap, tends to be larger in states where surveys show greater racial prejudice. See Kerwin Kofi Charles and Jonathan Guryan, “Prejudice and the Economics of Discrimination,” NBER Working Paper No. 13661, December 2007, https://www.nber.org/papers/w13661. Recent research suggests that lower levels of inequality are associated with stronger economic growth, and redistributive public policies seem benign in their impact on growth, at least unless they are extreme in their impact. While this research is not definitive, it is strongly suggestive. See Ostry et al., “Redistribution, Inequality, and Growth,” International Monetary Fund, April 2014, https://www.imf.org/external/pubs/ft/sdn/2014/sdn1402.pdf. See also Heather Boushey and Carter C. Price, “How are economic inequality and growth connected?,” Washington Center for Equitable Growth, October 2014, https://equitablegrowth.org/economic-inequality-growth-connected/.
[5] This paper often refers to racial and ethnic equity rather than just racial equity to acknowledge that some people of color identify more with their ethnic heritage than with a racial group.
[6] See, for example, C. Kirabo Jackson, Rucker C. Johnson, and Claudia Persico, “The Effects of School Spending on Educational and Economic Outcomes: Evidence from School Finance Reforms,” Quarterly Journal of Economics, October 1, 2015.
[7] See Michael Mitchell et al., “Unkept Promises: State Cuts to Higher Education Threaten Access and Equity,” Center on Budget and Policy Priorities, October 4, 2018, https://www.cbpp.org/research/state-budget-and-tax/unkept-promises-state-cuts-to-higher-education-threaten-access-and.
[8] See, for example, Chuck Marr et al., “EITC and Child Tax Credit Promote Work, Reduce Poverty, and Support Children’s Development, Research Finds,” Center on Budget and Policy Priorities, updated October 1, 2015, https://www.cbpp.org/research/federal-tax/eitc-and-child-tax-credit-promote-work-reduce-poverty-and-support-childrens; Elizabeth Wolkomir, “SNAP Boosts Retailers and Local Economies,” Center on Budget and Policy Priorities, updated April 6, 2018, https://www.cbpp.org/research/food-assistance/snap-boosts-retailers-and-local-economies; Barbara Sard et al., “Federal Policy Changes Can Help More Families with Housing Vouchers Live in Higher-Opportunity Areas,” September 4, 2018, https://www.cbpp.org/research/housing/federal-policy-changes-can-help-more-families-with-housing-vouchers-live-in-higher.
[9] See, for example, Center on Budget and Policy Priorities, “Chart Book: The Far-Reaching Benefits of the Affordable Care Act’s Medicaid Expansion,” October 2, 2018, https://www.cbpp.org/research/health/chart-book-the-far-reaching-benefits-of-the-affordable-care-acts-medicaid.
[10] Hsieh et al., 2018; Charles and Guryan, 2007; Ostry et al., 2014; Boushey and Price, 2014.
[11] For more on the racial wealth gap, see for example William Darity et al., “What We Get Wrong About Closing the Racial Wealth Gap,” Samuel DuBois Cook Center on Social Equity & Insight Center for Community Economic Development, April 2018, https://socialequity.duke.edu/sites/socialequity.duke.edu/files/site-images/FINAL%20COMPLETE%20REPORT_.pdf, and Thomas Shapiro, Tatjana Meschede, and Sam Osoro, “The Roots of the Widening Racial Wealth Gap: Explaining the Black-White Economic Divide,” Institute on Assets and Social Policy, Research and Policy Brief, February 2013, https://iasp.brandeis.edu/pdfs/Author/shapiro-thomas-m/racialwealthgapbrief.pdf.
[12] For the latest Census data on household income by race, see https://www.census.gov/library/publications/2018/demo/p60-263.html. See also Erica Williams, “States Should Adopt Policies to Help Dismantle Racial Barriers to Broader Prosperity, Center on Budget and Policy Priorities, September 13, 2018, https://www.cbpp.org/blog/states-should-adopt-policies-to-help-dismantle-racial-barriers-to-broader-prosperity.
[13] Edward N. Wolff, “Household Wealth Trends in the United States, 1962-2016: Has Middle Class Wealth Recovered?” NBER Working Paper No. 24085, Table 2, http://www.nber.org/papers/w24085.
[14] CBPP analysis of data from the 2016 Survey of Consumer Finances. Demos did a similar analysis using the 2013 SCF data here: https://www.demos.org/blog/9/5/14/top-10-white-families-own-almost-everything.
[15] Jess Gilbert, Spencer D. Wood, and Gwen Sharp, “Who Owns the Land? Agricultural Land Ownership by Race/Ethnicity,” Rural America, U.S. Department of Agriculture, Winter 2002, Vol. 17, Issue 4, pp. 55-62.
[16] Michael McManus, “Minority Business Ownership: Data from the 2012 Survey of Business Owners,” U.S. Small Business Administration Office of Advocacy, Issue Brief No. 12, September 14, 2016, https://www.sba.gov/sites/default/files/advocacy/Minority-Owned-Businesses-in-the-US.pdf.
[17] People who identify with a Latin American or Hispanic ethnicity may prefer to be identified in various ways including as Hispanic, Latino, Latina, Latinx, or with a more specific country of origin. In this report we use the gender-neutral term “Latinx.” We also use “Hispanic” where appropriate, for instance in cases when a data source uses that term.
[18] Lisa J. Dettling et al., “Recent Trends in Wealth-Holding by Race and Ethnicity: Evidence from the Survey of Consumer Finances,” The Federal Reserve, FEDS Notes, September 27, 2017, https://www.federalreserve.gov/econres/notes/feds-notes/recent-trends-in-wealth-holding-by-race-and-ethnicity-evidence-from-the-survey-of-consumer-finances-20170927.htm.
[19] Christian E. Weller and Jeffrey Thompson, “ Wealth Inequality Among Asian Americans Greater Than Among Whites,” Center for American Progress, December 20, 2016, https://www.americanprogress.org/issues/race/reports/2016/12/20/295359/wealth-inequality-among-asian-americans-greater-than-among-whites/.
[20] See Valerie Wilson and Zane Mokhiber, “2016 ACS shows stubbornly high Native American poverty and different degrees of economic well-being for Asian ethnic groups,” Economic Policy Institute, September 15, 2017, https://www.epi.org/blog/2016-acs-shows-stubbornly-high-native-american-poverty-and-different-degrees-of-economic-well-being-for-asian-ethnic-groups; and Jay L. Zagorsky, “Native Americans’ Wealth,” Chapter 5 in Gordon Nembhard and Chiteji (eds.), Wealth Accumulation and Communities of Color in the United States: Current Issues, University of Michigan Press, 2006.
[21] See Rakesh Kochhar and Anthony Cilluffo, ”How wealth inequality has changed in the U.S. since the Great Recession, by race, ethnicity and income,” Pew Research Center, November 1, 2017, http://www.pewresearch.org/fact-tank/2017/11/01/how-wealth-inequality-has-changed-in-the-u-s-since-the-great-recession-by-race-ethnicity-and-income/.
[22] For instance, between 1887 and 1934, after the passage of the Dawes Act, some 86 million acres of land owned by Native Americans was given to non-Indians. See Judith Nies, Native American History, Ballantine Books, 1996, p. 295. See also Roxanne Dunbar-Ortiz, An Indigenous Peoples’ History of the United States, Beacon Press, 2014, pp. 157-161.
[23] See, for example, Richard Rothstein, The Color of Law: A Forgotten History of How Our Government Segregated America, Liveright, 2017.
[24] This research is summarized in New York Times Editorial Board, “How Segregation Destroys Black Wealth,” September 15, 2015, https://www.nytimes.com/2015/09/15/opinion/how-segregation-destroys-black-wealth.html.
[25] Margery Austin Turner et al., Housing Discrimination and Racial and Ethnic Minorities 2012, Prepared for the U.S. Department of Housing and Urban Development, June 2013, https://www.huduser.gov/portal/Publications/pdf/HUD-514_HDS2012.pdf.
[26] Lincoln Quillian et al., “Meta-analysis of field experiments shows no change in racial discrimination in hiring over time,” Proceedings of the National Academy of Sciences, September 12, 2017, http://www.pnas.org/content/early/2017/09/11/1706255114?sid=5ac32c31-b27d-4db5-b50f-0fe04298c38b.
[27] Marianne Bertrand and Sendhil Mullainathan, Are Emily and Greg More Employable than Lakisha and Jamal? A Field Experiment on Labor Market Discrimination, NBER Working Paper No. 9873, July 2003, http://www.nber.org/papers/w9873.
[28] Devah Pager, Bruce Western, and Bart Bonikowski, Discrimination in a Low-Wage Labor Market: A Field Experiment, IZA Discussion Paper No. 4469, October 2009, http://ftp.iza.org/dp4469.pdf.
[29] See examples of this research in Cheryl Staats et al., “State of the Science: Implicit Bias Review,” Kirwan Institute, 2016, http://kirwaninstitute.osu.edu/wp-content/uploads/2016/07/implicit-bias-2016.pdf.
[30] See, for example, Cheryl Staats et al., “State of the Science: Implicit Bias Review,” Kirwan Institute, 2017, http://kirwaninstitute.osu.edu/implicit-bias-training/resources/2017-implicit-bias-review.pdf; National Initiative for Building Community Trust and Justice, “Implicit Bias,” https://trustandjustice.org/resources/intervention/implicit-bias; and Center for Family Policy and Practice, “Racial Stereotypes Can Affect Case Management Decisions,” October 5, 2012, https://cffpp.org/racial-stereotypes-can-affect-case-management-decisions-october-5-2012/.
[31] Official proceedings, Day 2 – Alabama Legislature, May 22, 1901, available at http://www.legislature.state.al.us/aliswww/history/constitutions/1901/proceedings/1901_proceedings_vol1/day2.html.
[32] For national population by race in 1970, see Campbell Gibson and Kay Jung, “Historical Census Statistics on Population Totals by Race, 1790 to 1990, and by Hispanic Origin, 1970 to 1990, for the United States, Regions, Divisions, and States,” Population Division Working Paper No. 56, September 2002, https://www.census.gov//content/dam/Census/library/working-papers/2002/demo/POP-twps0056.pdf. For estimate of state lawmakers by race in 1971, see Karl Kurtz, “Who We Elect: The Demographics of State Legislatures,” National Conference of State Legislatures, December 1, 2015, http://www.ncsl.org/research/about-state-legislatures/who-we-elect.aspx.
[33] See Kurtz, “Who We Elect,” race/ethnicity data spreadsheet available at http://www.ncsl.org/Portals/1/Documents/About_State_Legislatures/Raceethnicity_Rev2.pdf. See also New American Leaders Project, “States of Inclusion: New American Journeys to Elected Office,” 2016, https://www.newamericanleaders.org/wp-content/uploads/2017/05/States-of-Inclusion-FINAL-12516.pdf. For the U.S. population by racial/ethnic categories see U.S. Census Bureau Quick Facts at https://www.census.gov/quickfacts/fact/table/US/PST045217.
[34] Karen Shanton, “The Problem of African American Underrepresentation in City Councils,” Demos, 2014, https://www.demos.org/sites/default/files/publications/Underrepresentation_0.pdf.
[35] One study reports that before the Civil War began the owner of a 160-acre farm paid about $2.05 in taxes in Alabama and about $1.78 in Mississippi. Once Reconstruction was firmly underway, the same Alabama farmer paid about $4.57 (in 1870) and the Mississippi farmer paid about $6.31 (in 1871). J. Mills Thornton III, “Fiscal Policy and the Failure of Radical Reconstruction in the Lower South,” in Region, Race, and Reconstruction: Essays in Honor of C. Vann Woodward, edited by J. Morgan Kousser and James M. McPherson, Oxford University Press, New York, 1982.
[36] Eric Foner, “Reconstruction: America’s Unfinished Revolution, 1863–1877,” 2014 (updated version), HarperPerennial, 2014.
[37] See Albert D. Kirwin, Revolt of the Rednecks: Mississippi Politics 1876-1925, University of Kentucky Press, 1951, pp. 79-84. Some delegates favoring reapportionment may have sought it primarily to reduce the political dominance of whites in the Delta region, but some also argued it was necessary as a bulwark against the reemergence of African American political power, particularly given uncertainty as to whether the federal courts would allow the voting restrictions to stand.
[38] Dorothy Overstreet Pratt, Sowing the Wind: The Mississippi Constitutional Convention of 1890, University Press of Mississippi, 2018, p. 130-131. See also Michael Perman, Struggle for Mastery: Disenfranchisement in the South, 1888-1908, University of North Carolina Press, 2001, p. 82.
[39] Today, 16 states have some form of supermajority requirement to raise revenue, including states with statutory requirements. In January 2019, Florida will implement a new constitutional supermajority requirement to raise revenues, expanding an existing requirement that is more narrowly targeted to increases in corporate income tax rates. See Michael Leachman, Nicholas Johnson, and Dylan Grundman, “Six Reasons Why Supermajority Requirements to Raise Taxes Are a Bad Idea,” Center on Budget and Policy Priorities, February 14, 2012, https://www.cbpp.org/research/six-reasons-why-supermajority-requirements-to-raise-taxes-are-a-bad-idea.
[40] Mississippi Department of Archives and History, Proceedings of the Reunion of the Survivors of the Constitutional Convention of 1890, November 1, 1910.
[41] Today, 44 states and the District of Columbia impose some kind of limit on property taxes. For a full list of property tax limits still on the books today, by year of enactment, see Bethany P. Paquin, “Chronicle of the 161-Year History of State-Imposed Property Tax Limitations,” Working Paper WP15BP1, Lincoln Institute of Land Policy, April 2015, Appendix B, https://www.lincolninst.edu/sites/default/files/pubfiles/paquin-wp15bp1.pdf. See also Lav and Leachman, 2018.
[42] See Lav and Leachman, 2018.
[43] Ibid.
[44] Constitution of 1875, State of Alabama, Article XI, Sections 4, 5, and 7, http://www.legislature.state.al.us/aliswww/history/constitutions/1875/1875all.html.
[45] The 1901 constitution actually lowered further the cap on state property tax rates. See Malcolm Cook McMillan, Constitutional Development in Alabama, 1798-1901: A Study in Politics, the Negro, and Sectionalism, The Reprint Company, Spartanburg, South Carolina, 1978, p. 306. See also Constitution of the State of Alabama, 1901, available at http://digital.archives.alabama.gov/cdm/ref/collection/voices/id/3476.
[1] Knight v. Alabama, 458 F. Supp. 2d 1273 (N.D. Ala. 2004), https://law.justia.com/cases/federal/district-courts/FSupp2/458/1273/2568095/.
[47] Thornton, 1982.
[48] The harm done by the tax limits was evident not long after they were adopted in Alabama’s 1875 convention, as cities and counties were forced to take on a large amount of bonded debt to provide public investments without exceeding the tax limits. Delegates to the 1901 convention from urban areas sought relief from the limits, but more powerful white delegates from the Black Belt refused the relief. See McMillan, Constitutional Development in Alabama, pp. 328-330. Alabama’s state and local property tax revenue as a share of personal income in the state was 1.4 percent in 2016, the lowest in the country. (CBPP analysis of data from the Census Bureau and the Bureau of Economic Analysis.)
[49] See Paquin, 2015.
[50] Mississippi House Journal, 1932, p. 787, accessed through the University of Mississippi libraries.
[51] Jon C. Teaford, The Rise of the States: Evolution of American State Government, Johns Hopkins University Press, Baltimore, 2002, pp. 135-136.
[52] See A.H. Stone, “The Mississippi Sales Tax,” Proceedings of the Annual Conference on Taxation under the Auspices of the National Tax Association, Vol. 26, October 16-19, 1933, pp. 223-233.
[53] Teaford, 2002, pp. 136-138. An example of the influence of Mississippi’s experience on other states can be found in the proceedings of the 1933 conference of the National Tax Association. The presiding state tax official, from Indiana, notes that the head of his state’s tax department visited Mississippi to learn from its experience. Indiana subsequently became the second state with a modern retail sales tax. For a list of when states adopted retail sales taxes, see W. Bartley Hildreth and James A. Richardson, eds., Handbook on Taxation, Marcell Dekker, Inc., New York, 1999, p. 73.
[54] Institute on Taxation and Economic Policy, Who Pays? 6th edition, October 2018, https://itep.org/whopays/.
[55] Gilbert Thomas Stephenson, Race Distinctions in American Law, D. Appleton & Company: New York, 1910, pp. 196-198.
[56] Robert Margo, “Race Differences in Public School Expenditures: Disenfranchisement and School Finance in Louisiana, 1890-1910,” Social Science History, Vol. 6, No. 1, Winter 1982, pp. 9-33. See also Knight v. Alabama, 458 F. Supp. 2d 1273 (N.D. Ala. 2004), Nos. 30-31, https://law.justia.com/cases/federal/district-courts/FSupp2/458/1273/2568095/.
[57] Mark Kanazawa, “Immigration, Exclusion, and Taxation: Anti-Chinese Legislation in Gold Rush California,” Journal of Economic History, Vol. 65, No. 3, September 2005, pp. 779-805.
[58] Not all tax assessors were elected officials; some were appointed. These appointed officials were ultimately responsible to the elected officials who appointed them, and these elected officials owed their elections to a voting public that was overwhelmingly white.
[59] Andrew Kahrl, “Power to Destroy: Discriminatory Property Assessments and the Struggle for Tax Justice in Mississippi,” The Journal of Southern History, Vol. 82, No. 3, August 2016, p. 581.
[60] Ibid, p. 600.
[61] For a summary and broader context see Richard Rothstein, The Color of Law, Liveright Pubishing Corporation: New York, 2017, particularly pp.169-172.
[62] Arthur D. Little, Inc., “A Study of Property Taxes and Urban Blight,” a report to the U.S. Department of Housing and Urban Development, January 1973.
[63] Andrew Kahrl, “Capitalizing on the Urban Fiscal Crisis: Predatory Tax Buyers in 1970s Chicago,” Journal of Urban History, Vol. 44, Issue 3, May 2018, pp. 382-401.
[64] Michael Leachman, “Minnesota’s Tax Plan a Recipe for Future Growth,” Center on Budget and Policy Priorities, May 21, 2013, https://www.cbpp.org/blog/minnesotas-tax-plan-a-recipe-for-future-growth.
[65] Institute on Taxation and Economic Policy, 2018.
[66] Ibid.
[67] Ibid.
[68] The top bracket for single filers begins at: $551,473 in California; $500,000 in Connecticut and New Jersey; $1,077,550 in New York. The top bracket for single filers begins at $200,000 in Hawaii ($400,000 for joint filers); $250,000 in Maryland ($300,000 for joint filers); $160,020 in Minnesota ($300,000 for joint filers); $125,000 in Oregon ($250,000 for joint filers); and $416,700 in Vermont (same for joint filers). For all brackets and rates see https://www.taxadmin.org/assets/docs/Research/Rates/ind_inc_070118.pdf.
[69] Arthur B. Laffer and Stephen Moore, “Laffer and Moore: The Red-State Path to Prosperity,” Wall Street Journal, March 27, 2013, https://www.wsj.com/articles/SB10001424127887324532004578362053722832998.
[lxix] Dedrick Asante-Muhammad et al., “The Road to Zero Wealth: How the Racial Wealth Divide Is Hollowing Out America’s Middle Class,” Institute for Policy Studies and Prosperity Now, September 2017, https://ips-dc.org/wp-content/uploads/2017/09/The-Road-to-Zero-Wealth_FINAL.pdf.
[70] See Michael Mazerov, “The ‘Single Sales Factor’ Formula for State Corporate Taxes: A Boon to Economic Development or a Costly Giveaway?” Center on Budget and Policy Priorities, revised September 2005, https://www.cbpp.org/archiveSite/3-27-01sfp.pdf. See also Michael Mazerov, “Case for ‘Single Sales Factor’ Tax Cut Now Much Weaker, Center on Budget and Policy Priorities, April 1, 2015, https://www.cbpp.org/blog/case-for-single-sales-factor-tax-cut-now-much-weaker.
[71] Lisa J Dettling et al., “Recent Trends in Wealth-Holding by Race and Ethnicity: Evidence from the Survey of Consumer Finances,” Board of Governors of the Federal Reserve System, September 2017, https://www.federalreserve.gov/econres/notes/feds-notes/recent-trends-in-wealth-holding-by-race-and-ethnicity-evidence-from-the-survey-of-consumer-finances-20170927.htm.
[72] Maryland is among the 12 states with an estate tax and also operates a small inheritance tax, making it the sixth state with an inheritance tax.
[73] Center on Budget and Policy Priorities, “Many States Tax Inherited Wealth, 17 States Levy and Estate or Inheritance Tax,” updated July 30, 2018, https://www.cbpp.org/research/state-budget-and-tax/many-states-tax-inherited-wealth.
[74] Elizabeth McNichol, “State Estate Taxes: A Key Tool for Broad Prosperity,” Center on Budget and Policy Priorities, May 11, 2016, https://www.cbpp.org/research/state-budget-and-tax/state-estate-taxes-a-key-tool-for-broad-prosperity. For a more recently updated list of states with estate and inheritance taxes see CBPP, “Many States Tax Inherited Wealth.”
[75] Economic Policy Institute, State of Working America Data Library, “Poverty-Level Wages,” 2018, http://www.epi.org/data/#/?subject=povwage&g=*&r=*.
[76] Annie E. Casey Foundation, “2017 Kids Count Databook,” June 2017, http://www.aecf.org/m/resourcedoc/aecf-2017kidscountdatabook.pdf; Quillian et al., “2017.
[77] Marr et al., 2015; Greg J. Duncan, Pamela A. Morris, and Chris Rodrigues, “Does Money Really Matter? Estimating Impacts of Family Income on Young Children’s Achievement with Data from Random-Assignment Experiments,” Developmental Psychology, June 2011, pp. 1263–1279.
[78] Michelle Maxfield, “The Effects of the Earned Income Tax Credit on Child Achievement and Long-Term Educational Attainment,” Michigan State University Job Market Paper, November 14, 2013, https://www.msu.edu/~maxfiel7/20131114%20Maxfield%20EITC%20Child%20Education.pdf; Katherine Michelmore, “The Effect of Income on Educational Attainment: Evidence from State Earned Income Tax Credit Expansions,” November 2013, https://ssrn.com/abstract=2356444; Gordon Dahl and Lance Lochner, “The Impact of Family Income on Child Achievement: Evidence from the Earned Income Tax Credit,” American Economic Review, August 2012, pp. 1927-1956.
[79] United States Department of Justice Civil Rights Division, “Investigation of the Ferguson Police Department,” March 4, 2015, https://www.justice.gov/sites/default/files/opa/press-releases/attachments/2015/03/04/ferguson_police_department_report.pdf.
[80] Among many examples see the Brennan Center for Justice’s work in this area at https://www.brennancenter.org/criminal-justice-debt; work by the American Civil Liberties Union at https://www.aclu.org/issues/smart-justice/sentencing-reform/ending-modern-day-debtors-prisons; and work by the Vera Institute of Justice at https://www.vera.org/projects/past-due-examining-the-true-costs-of-the-user-pay-justice-system-in-new-orleans.
[81] Council of Economic Advisors Issue Brief, “Fees, Fines, and Bail: Payments in the Criminal Justice System that Disproportionately Impact the Poor,” December 2015, p. 3, https://obamawhitehouse.archives.gov/sites/default/files/page/files/1215_cea_fine_fee_bail_issue_brief.pdf. See also Karen Dolan and Jodi L. Carr, “The Poor Get Prison: The Alarming Spread of the Criminalization of Poverty,” Institute for Policy Studies, March 2015, p. 10, http://www.ips-dc.org/the-poor-get-prison-the-alarming-spread-of-the-criminalization-of-poverty/.
[82] German Lopez, “Study: cities rely more on fines for revenue if they have more black residents,” Vox, July 7, 2017, https://www.vox.com/identities/2017/7/7/15929196/police-fines-study-racism.
[83] Mathilde Laisne, Jon Wool, and Christian Henrichson, “Past Due: Examining the Costs and Consequences of Charging for Justice in New Orleans,” Vera Institute of Justice, January 2017, https://www.vera.org/publications/past-due-costs-consequences-charging-for-justice-new-orleans.
[84] Mitchell et al., 2018.
[85] Marr et al., 2015; Wolkomir, 2018; Sard et al., 2018.
[86] Elizabeth McNichol, “Strategies to Address the State Tax Volatility Problem,” Center on Budget and Policy Priorities, April 18, 2013, https://www.cbpp.org/research/strategies-to-address-the-state-tax-volatility-problem.
[87] Estimates of the annual cost to states and localities of these subsidies range from $45 billion to $90 billion. See Timothy Bartik, “A New Panel Database on Business Incentives for Economic Development Offered by State and Local Governments in the United States,” 2017, W.E. Upjohn Institute for Employment Research, prepared for the Pew Charitable Trusts, pp. 6, 47-48, https://research.upjohn.org/reports/225. See also Timothy Bartik, “Who Benefits From Economic Development Incentives? How Incentive Effects on Local Incomes and the Income Distribution Vary with Different Assumptions about Incentive Policy and the Local Economy,” W.E. Upjohn Institute for Employment Research, Report No. 18-034, March 2018, https://research.upjohn.org/up_technicalreports/34/.
[88] Michael Mazerov, “A Majority of States Have Now Adopted a Key Corporate Tax Reform — ‘Combined Reporting,’” Center on Budget and Policy Priorities, revised April 3, 2009, https://www.cbpp.org/research/a-majority-of-states-have-now-adopted-a-key-corporate-tax-reform-combined-reporting.
[89] Michael Mazerov, “Expanding Sales Taxation of Services: Options and Issues,” Center on Budget and Policy Priorities, August 10, 2009, https://www.cbpp.org/research/state-budget-and-tax/expanding-sales-taxation-of-services-options-and-issues.
[90] Michael Mazerov, “State and Local Governments Should Close Online Hotel Tax Loophole and Collect Taxes Owed,” Center on Budget and Policy Priorities, April 12, 2011, https://www.cbpp.org/cms/index.cfm?fa=view&id=3467.
[91] Chad Stone, “Putting a Price on Carbon Can Be a Budget Policy/Energy Policy ‘Two-Fer,’” Center on Budget and Policy Priorities, March 29, 2012, https://www.cbpp.org/blog/putting-a-price-on-carbon-can-be-a-budget-policyenergy-policy-two-fer.
[92] See Chad Stone, “The Design and Implementation of Policies to Protect Low-Income Households Under a Carbon Tax,” Center on Budget and Policy Priorities, September 21, 2015, https://www.cbpp.org/research/climate-change/the-design-and-implementation-of-policies-to-protect-low-income-households.
[93] See Headwaters Economics, “Oil and Natural Gas Fiscal Best Practices: Lessons for State and Local Governments,” November 2012, https://headwaterseconomics.org/wp-content/uploads/Energy_Fiscal_Best_Practices.pdf. See also Diana Polson and Stephen Herzenberg, “It’s Time for a Real Severance Tax in Pennsylvania,” Pennsylvania Budget and Policy Center, June 27, 2017, https://www.pennbpc.org/sites/default/files/Severance_Tax_Brief_Final.pdf.
[94] Center on Budget and Policy Priorities, “Federal Aid to State and Local Governments,” April 19, 2018, https://www.cbpp.org/research/state-budget-and-tax/federal-aid-to-state-and-local-governments.
[95] Michael Leachman and Michael Mazerov, “How Should States Respond to Recent Federal Tax Changes,” Center on Budget and Policy Priorities, January 23, 2018, https://www.cbpp.org/research/state-budget-and-tax/how-should-states-respond-to-recent-federal-tax-changes.
[96] Chuck Marr, Brendan Duke, and Chye-Ching Huang, “New Tax Law Is Fundamentally Flawed and Will Require Basic Restructuring,” Center on Budget and Policy Priorities, April 9, 2018, https://www.cbpp.org/research/federal-tax/new-tax-law-is-fundamentally-flawed-and-will-require-basic-restructuring.
[97] For example, see Center on Budget and Policy Priorities, “How States Should Respond to the Federal Tax Cuts for ‘Pass Through’ Business Income, March 27, 2018, https://www.cbpp.org/research/state-budget-and-tax/how-states-should-respond-to-the-federal-tax-cuts-for-pass-through.
[98] California’s recent experience reforming its education funding formula provides a useful example, particularly as the state is still working toward full implementation. See Jonathan Kaplan, “What Reaching LCFF Full Implementation Means and Why It Matters,” California Budget and Policy Center, April 9, 2018, https://calbudgetcenter.org/blog/what-reaching-lcff-full-implementation-means-and-why-it-matters/.
[99] See Michael Mitchell and Michael Leachman, “Changing Priorities: State Criminal Justice Reforms and Investments in Education,” Center on Budget and Policy Priorities, October 28, 2014, https://www.cbpp.org/research/changing-priorities-state-criminal-justice-reforms-and-investments-in-education.
[100] Center on Budget and Policy Priorities, “Policy Basics: State Supermajority Rules to Raise Revenue,” updated February 5, 2018, https://www.cbpp.org/research/state-budget-and-tax/policy-basics-state-supermajority-rules-to-raise-revenues.
[101] See Michael Leachman, Nicholas Johnson, and Dylan Grundman, “Six Reasons Why Supermajority Requirements to Raise Taxes Are a Bad Idea,” Center on Budget and Policy Priorities, February 14, 2012, https://www.cbpp.org/research/six-reasons-why-supermajority-requirements-to-raise-taxes-are-a-bad-idea.
[102] Voters approved the supermajority requirement on November 6, 2018. For the bill text see http://flsenate.gov/Session/Bill/2018/7001/BillText/Filed/PDF. See also “Not So Super: Florida’s Supermajority Proposal Endangers Economic Growth and Thriving Communities,” Florida Policy Institute, June 2018, https://www.fpi.institute/not-so-super-floridas-supermajority-proposal-endangers-economic-growth-and-thriving-communities/.
[103] Such an error is far from unheard of; states as diverse as Arizona and Maryland have enacted tax credits that turned out to be much easier to claim — and therefore had much greater impact on the state treasury — than was originally intended when the credit was enacted.
[104] For instance, Moody’s specifically cited supermajority requirements in Arizona and Nevada as reasons for downgrading those states’ bonds in the aftermath of the last recession. See Moody’s Investor Services, Global Credit Research Press Release, “Moody’s Downgrades State of Nevada’s General Obligation Bonds to Aa2 from Aa1,” March 24, 2011; and Moody’s Investor Services, Global Credit Research Press Release, “Moody’s Downgrades State of Arizona’s Issuer Rating to Aa3 from Aa2,” July 15, 2010.
[105] Center for Governmental Studies, “Reforming California’s Budget Process: Preliminary Report and Recommendations of the California Citizens Budget Commission,” 1995, pp.43-47.
[106] See Iris Lav and Michael Leachman, “State Limits on Property Taxes Hamstring Local Services and Should Be Relaxed or Repealed,” Center on Budget and Policy Priorities, July 18, 2018, https://www.cbpp.org/research/state-budget-and-tax/state-limits-on-property-taxes-hamstring-local-services-and-should-be.
[107] Institute on Taxation and Economic Policy, “Property Tax Circuit Breakers in 2018,” September 17, 2018, https://itep.org/property-tax-circuit-breakers-in-2018/.
[108] See Elizabeth McNichol, “When and How States Should Strengthen Their Rainy Day Funds,” Center on Budget and Policy Priorities, April 17, 2014, https://www.cbpp.org/research/state-budget-and-tax/when-and-how-states-should-strengthen-their-rainy-day-funds.
More from the Authors

Areas of Expertise

Areas of Expertise

Areas of Expertise